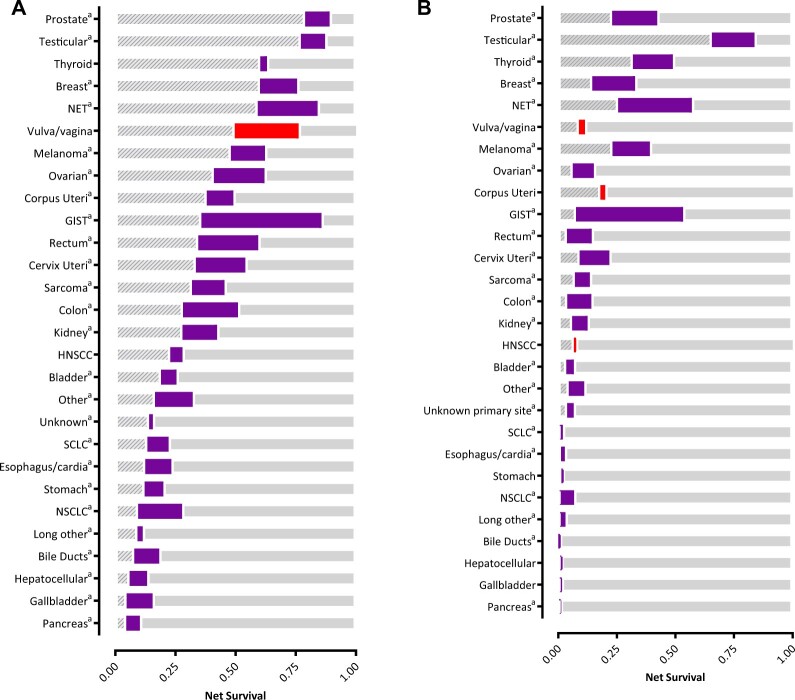
Figure 2.
Changes in 1- and 5-year net survival of de novo metastatic cancer patients with primary cancer diagnosis over 2 time periods: 1989-1993 vs 2014-2018 (purple = increase, red = reduction). A) Changes in 1-year net survival. B) Changes in 5-year net survival. The striped gray bar on the left represents the net survival in the period 1989-1993; the thicker purple bar represents the survival change from 1989-1993; and transparent gray bar on the right represents the proportion of survival that is still to gain. aSignificant difference in net survival of patients in 1989-1993 vs those in 2014-2018 (α = .01). GIST = gastrointestinal stromal tumors; HNSCC = head and neck squamous cell carcinoma; NET = neuroendocrine tumor; NSCLC = non-small cell lung cancer; SCLC = small cell lung cancer.

