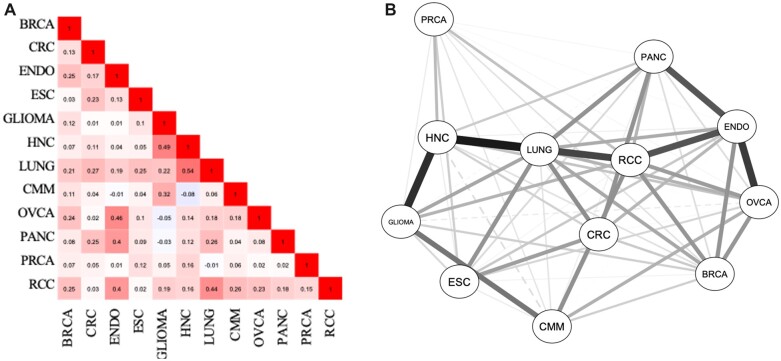
Figure 1.
Pairwise genetic correlations between cancers. (A) Matrix of pairwise genetic correlations. (B) Genetic correlation network. Distance between nodes, edge shade, and edge thickness corresponds to genetic correlation magnitudes. Dashed lines indicate negative correlations. BRCA = breast cancer; CMM = cutaneous melanoma; CRC =colorectal cancer; ENDO = endometrial cancer; ESC = esophageal cancer; HNC = head and neck cancer; OVCA = ovarian cancer; PANC = pancreatic cancer; PRCA = prostate cancer; RCC = renal cancer (see Supplementary Table 1, available online for numerical values and corresponding P values). (Fruchterman and Reingold, 1991).

