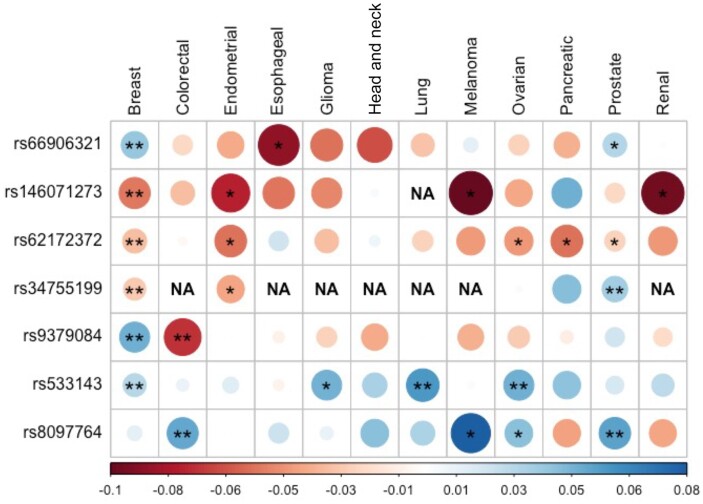
Figure 2.
Cancer-specific association results for the lead single-nucleotide polymorphisms of 7 newly identified cancer susceptibility loci. The circles correspond to cancer-specific log(odds ratios), with color corresponding to direction of effect and size and shade corresponding to magnitude of effect. *Cancer-specific P < .05. **Cancer-specific P < .001. See Supplementary Table 5 (available online) for cancer-specific odds ratios and P values. NA denotes instances where the variant was not present in the corresponding cancer.

