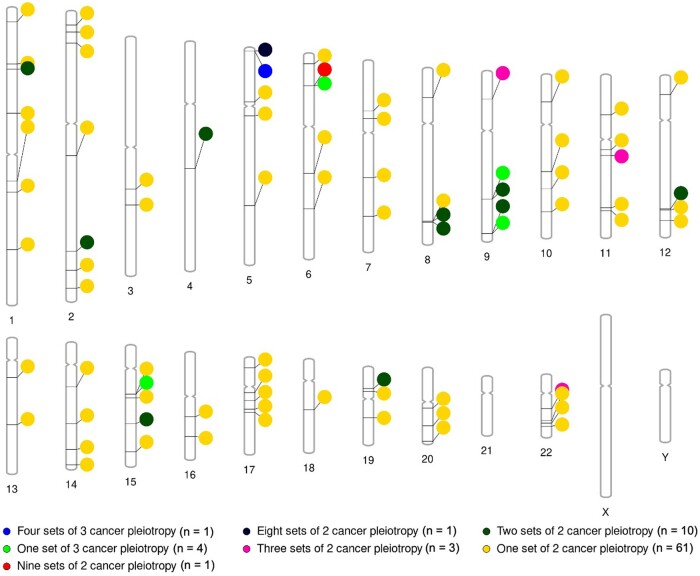
Figure 3.
Regions in the genome with evidence of variant-specific pleiotropy. Colors correspond to regions with 4 sets of 3-cancer pleiotropy (blue), 1 combination of 3-cancer pleiotropy (light green), 9 combinations of pairwise cancer pleiotropy (red), 8 combinations of pairwise cancer pleiotropy (black), 3 combinations of pairwise cancer pleiotropy (pink), 2 combinations of pairwise cancer pleiotropy (dark green), and 1 combination of pairwise cancer pleiotropy (yellow). Full results from the pleiotropic analyses can be found in Supplementary Tables 10-12 (available online).

