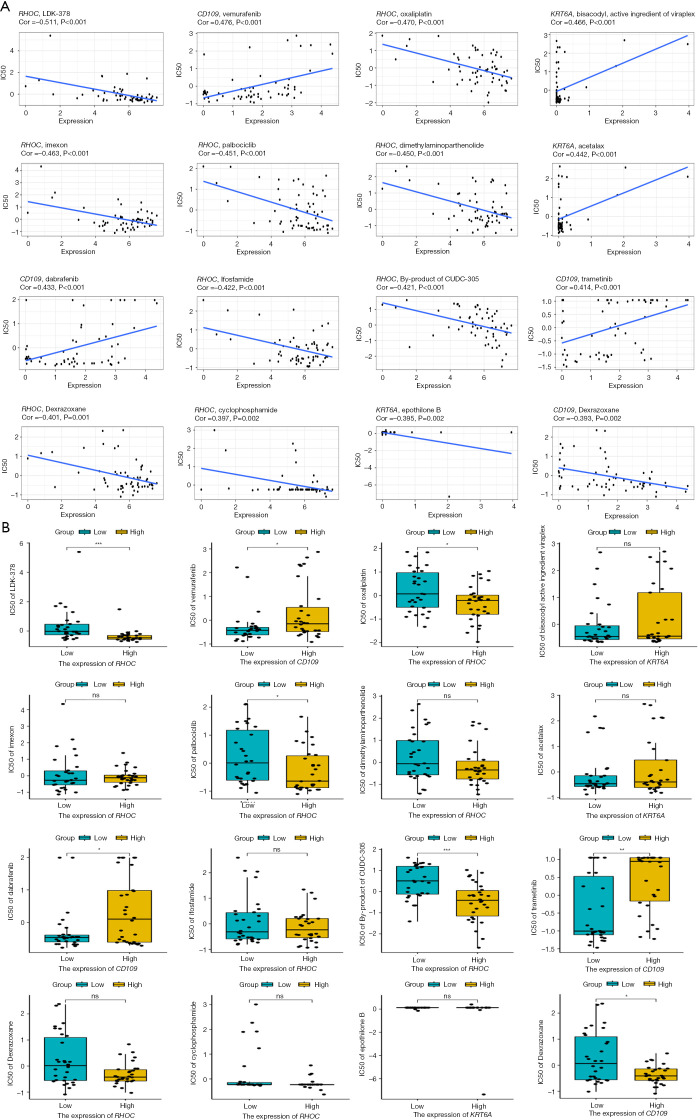
Figure 13.
The drug sensitivity of model genes was detected based on the CellMiner database. (A) Correlation diagram of RHOC, CD109, KRT6A, and other genes in terms of drug sensitivity. (B) Differences in the expression of RHOC, CD109, KRT6A, and drug sensitivity. IC50, half maximal inhibitory concentration; *, P<0.05; **, P<0.01; ***, P<0.001; ns, no statistical difference.

