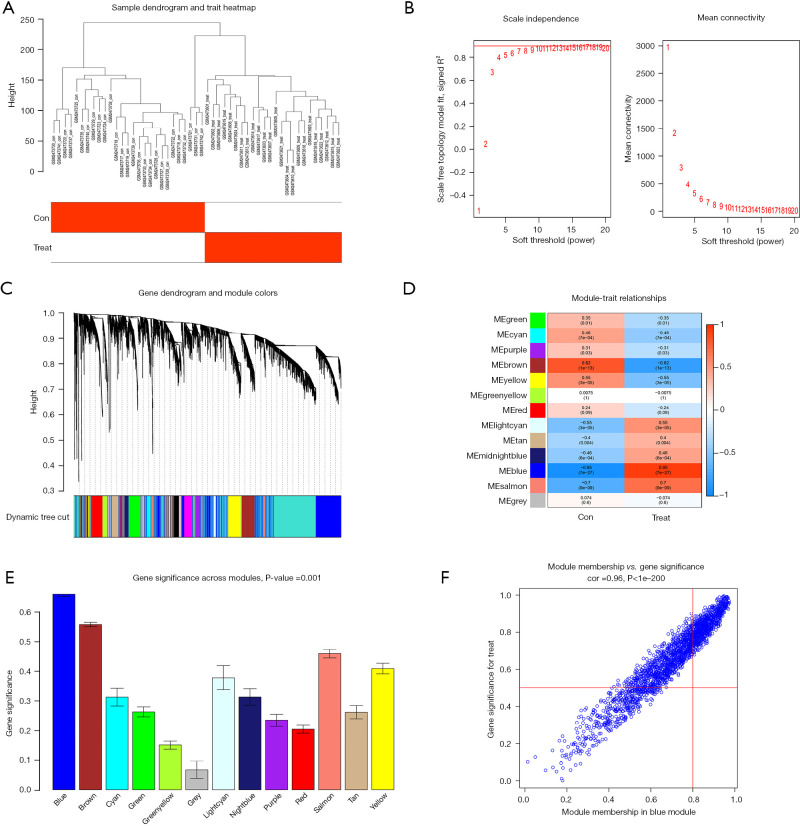
Figure 6.
WGCNA selection of the ACP disease-related modules. (A) Outliers were detected in the sample cluster. (B) The cut-off point was set as 0.9, and the soft threshold power was set as β=8. (C) Tree diagram of all the DEGs based on the cluster of difference measurement. The colored bands show the results from the automated monolithic analysis. (D) Correlation of blue modules with disease. (E) Importance analysis of module signature genes and phenotype correlations. We selected the MEblue module for subsequent analysis (the vertical values are the correlation coefficients for the feature modules). (F) Relevance of the MEblue to the disease. The vertical coordinate indicates the importance of the module gene in the disease, and the horizontal coordinate indicates the relevance of the module gene to the disease; the higher the score, the more important and more relevant the module in the disease. ME, module eigengene; WGCNA, weighted gene co-expression network analysis; ACP, adamantinomatous craniopharyngioma; DEGs, differentially expressed genes.

