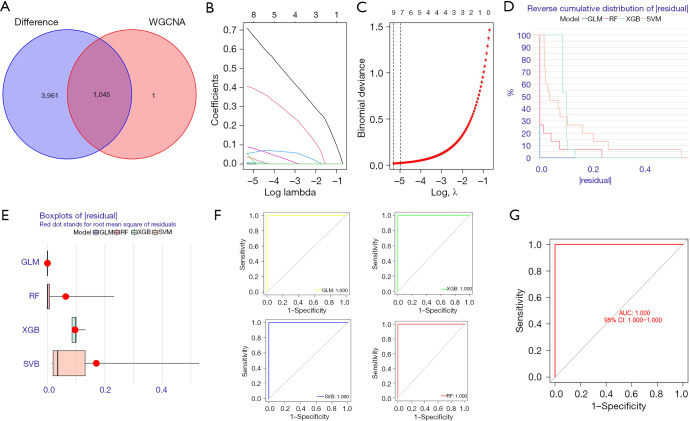
Figure 7.
LASSO and machine-learning build models. (A) A WGCNA was conducted to analyze the disease characteristic module and differential gene crossover. (B) The screening was carried out using LASSO regression analysis. (C) Cross validation: for each λ value, around the mean value of the target parameter shown in red, we obtained a confidence interval of the target parameter. The 2 dashed lines indicate 2 special λ values, respectively. (D) Reverse cumulative distribution of the residuals of the SVM, RF tree, GLM, and XGB. (E) Reverse cumulative distribution of the residuals of the SVM, RF tree, GLM, and XGB. The Y-axis value represents the percentile of the outliers. (F) ROC analysis of the SVM, RF tree, GLM and XGB. (G) ROC analysis of the GLM model in the GSE68015 validation set. WGCNA, weighted gene co-expression network analysis; GLM, generalized linear models; RF, random-forest; XGBoost, extreme gradient boosting; SVM, support vector machine; AUC, area under the curve; ROC, receiver operating characteristic; CI, confidence interval; LASSO, least absolute shrinkage and selection operator.

