Figure 5.
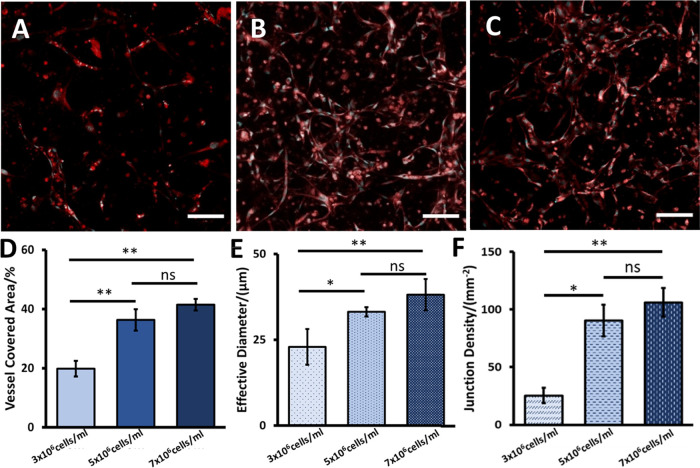
Vessel network formed by HUVECs at different concentrations. (A)–(C) Vessel network formed by 3 × 10⁶, 5 × 10⁶, and 7 × 10⁶ cells/mL HUVECs in fibrin gel, respectively. Scale bars are 100 μm. (D)–(F) Comparison of vessel covered area percentage, effective vessel diameter, and junction density measured from the vessel networks formed by HUVECs at different concentrations. Error bars show the standard derivation. *p < 0.05, **p < 0.01, ns is not significant, n = 3.

