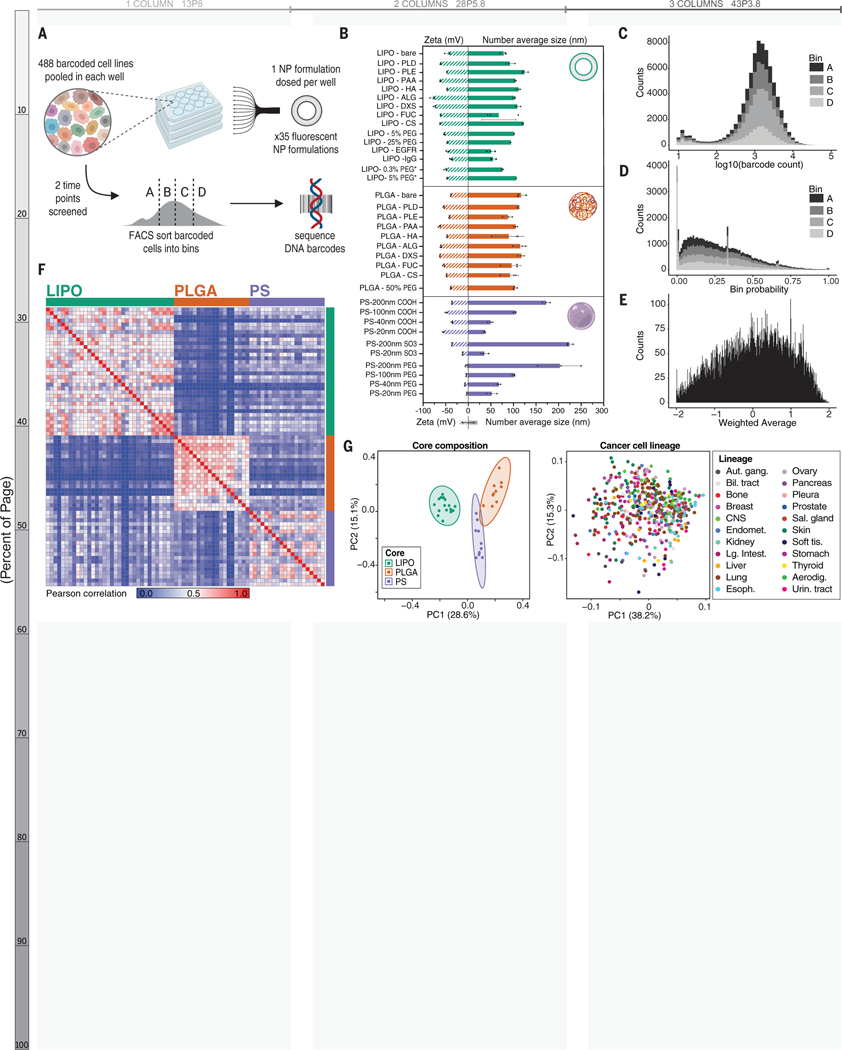
Figure 1. Assessing NP-cell interactions across hundreds of cancer cell lines simultaneously.
(A) Schematic of the nanoPRISM assay: Fluorescently-labeled NPs are incubated with pooled cancer cells before fluorescence-activated cell sorting (FACS) by NP-association and sequencing of DNA barcodes for downstream analyses. (B) Characterization of the diameter and zeta potential of the NP library via dynamic light scattering. Data are represented as the mean and standard deviation of three technical repeats. Formulations marked with an asterisk represent drug-free analogs of clinical liposomal formulations as described in the text. (C) Raw data from the screen were obtained in the form of barcode counts, with similar numerical distribution of barcodes in each bin, represented as a stacked histogram. (D) Accounting for baseline differences in barcode representation yields the probability (P) that each cell line will be found in a particular bin. (E) Probabilities are collapsed into a single weighted average (WA) for each NP-cell line pair. (F) A similarity matrix collapsing WA values for 488 cell lines reveals clusters of NP formulations with the same core formulation. (G) Principal component analysis (PCA) of NP-cell line WA values at 24 h confirms distinct clustering of NP formulations based on core composition (left) but cell lines do not form clusters (right).

