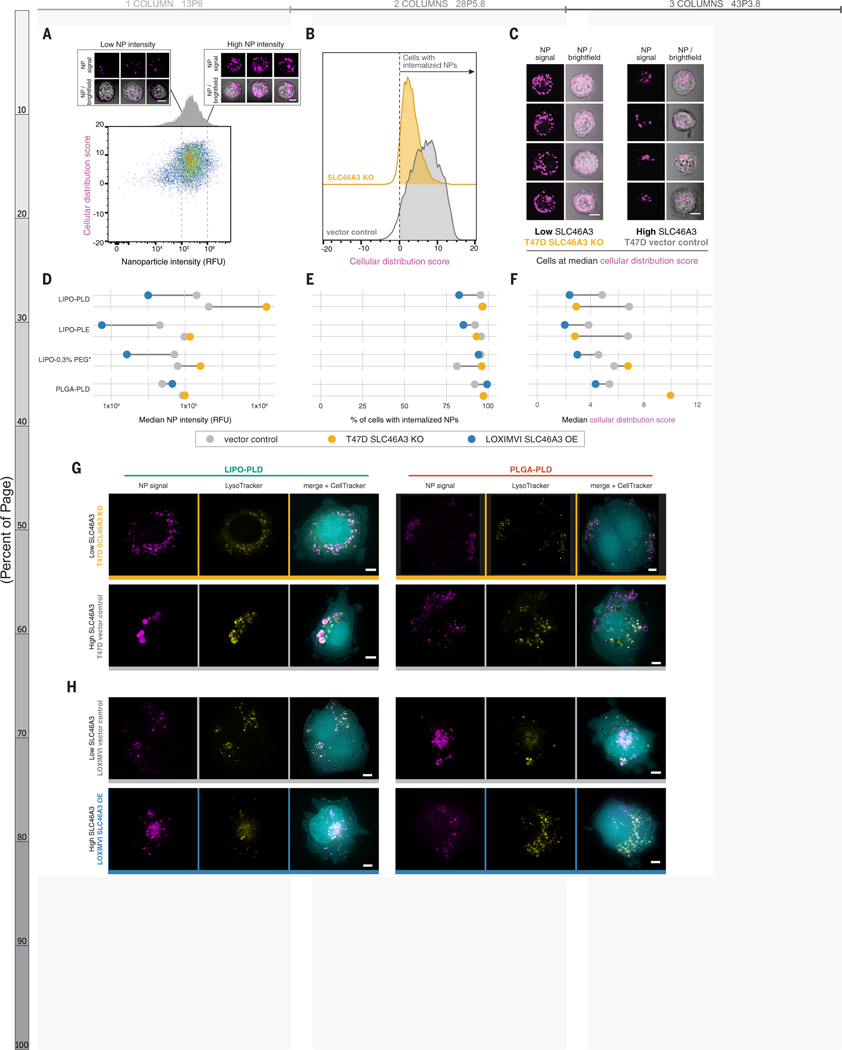
Figure 5. High-throughput imaging cytometry confirmed NP internalization and revealed SLC46A3-dependent changes to intracellular trafficking.
(A) Imaging cytometry was used to investigate the intensity (x-axis) and distribution (y-axis) of NPs in a high-throughput manner. Bivariate density plot of n=10,000 cells (T47D-vector control) after 24 h incubation with LIPO-PLD NPs, with representative cell images at low and high NP signal. (B) Cellular distribution patterns of NPs were scored such that scores greater than 0 indicate cells with internalized NPs. Representative data from LIPO-PLD NPs in engineered T47D cells are shown. (C) Representative cell images at the median cellular distribution score for engineered T47D cells treated with LIPO-PLD NPs. (D) Quantification of median intensity of tested NP formulations in engineered T47D and LOXIMVI cell lines demonstrated SLC46A3-dependent changes. (E) NPs remained predominantly internalized independent of SLC46A3 expression. (F) Shifts in the median cellular distribution scores were observed in response to SLC46A3 modulation. Live cell micrographs of (G) T47D-vector control and T47D-SLC46A3 knockout cells and (H) LOXIMVI-vector control and LOXIMVI-SLC46A3 OE cells incubated with LIPO-PLD and PLGA-PLD NPs for 24h. NP signal is pseudo-colored magenta, LysoTracker signal yellow, and CellTracker cyan. For A and C, scale bar = 7 μm. For G-H, scale bar = 5 μm.

