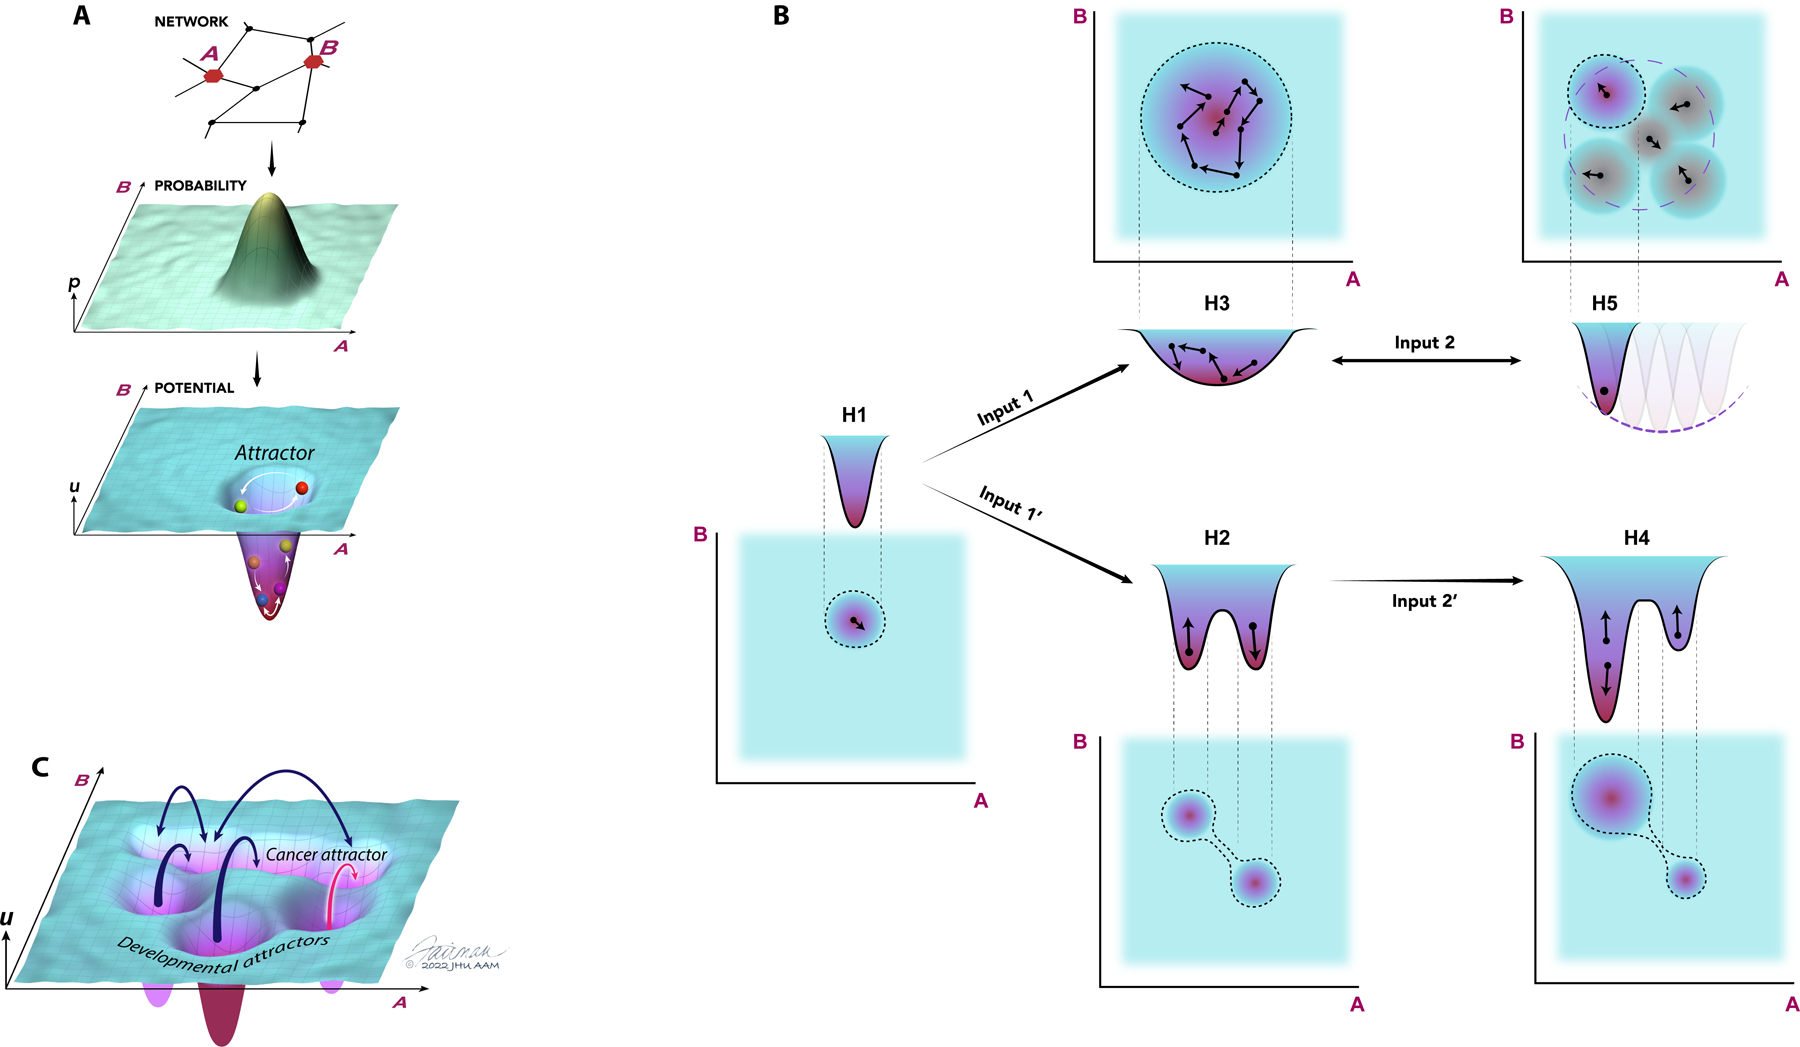
Figure 1. Gene expression and epigenetic landscapes control normal and cancer cell functions.

(A) Gene regulatory networks and availability of genes for expression can define the probabilistic distributions of proteins expressed within a cell population. In the example here, the network of interacting proteins that includes the molecules A and B (top) and the underlying epigenetic control determining the availability of the corresponding genes for expression define the distribution of expression of A and B (middle). This probability distribution can be experimentally measured and converted into a gene expression landscape by calculating the corresponding quasi-potential distribution (bottom, see Box). The epigenetic landscape can be similarly determined by experimentally measuring the probabilistic distributions of epi-alleles, DNA methylation marks at specific loci or by performing other measurements of epigenetic regulation across populations of cells and tissues, and then also converting these probability distributions into corresponding underlying quasi-potential landscapes. The landscape analysis allows conceptual accounting for abundance and dynamics of molecular species, shown here as a trajectory of particle inside a quasi-potential well, with the particle position defined by the current concentrations of A and B that can change probabilistically in time, with the quasi-potential wells interpreted as the landscape attractors. (B) Various scenarios of landscape alterations and the corresponding changes in the molecular distributions, shown as joint distributions of the molecules A and B and the corresponding entropies H1–5. Implementation of these scenarios in the context of carcinogens is extensively illustrated and discussed in the text. Oncogenic mutations of epigenetic modifiers and modulators or environmental inputs can lead to formation of new stable attractors with the overall entropy H2 greater than the original entropy H1 (H2>H1) generating phenotypic heterogeneity (Input 1’) or, alternatively, enlarge the existing attractor with the new entropy H3>H1, generating a more plastic state (phenotypic plasticity), with cells capable of stochastically and dynamically ‘exploring’ this attractor and thus transiently adopting different phenotypes. Note that in both cases entropy increases vs H1, and it is possible that H2=H3, thus making entropy less discriminating than the full landscape picture in the analysis of cell states. These new landscapes can be further altered by oncogenic and environmental inputs, so that one of the attractors becomes dominant (Inout 2’), associated with a lower entropy value (H4<H2), or, alternatively, with the narrowing of the wider (and more plastic) attractor (Inout 2, H5<H3). Again, it is possible that H4=H5, requiring the landscape analysis rather than entropy analysis alone for full characterization. The narrowing of the wide attractor due to either environmental or intrinsic inputs (Input 2) is frequently reversible and context dependent, further elaborating the more plastic overall state (transient nature of Input 2 described by a bidirectional arrow). The transiently occupied attractors can be simultaneously occupied by discerns cells in the population. Small arrows correspond to stochastic fluctuations of molecular concentrations within individual attractors. (C) Gene regulation and epigenetic landscapes of cancer cells can be complex and have multiple attractors, corresponding to distinct and stable cell states and phenotypes, which may be reshaped by oncogenic mutations, cell aging, environmental inputs and other perturbations, leading to mutual accessibility of the attractors, more plastic cell states and an increase in the phenotypic plasticity.
