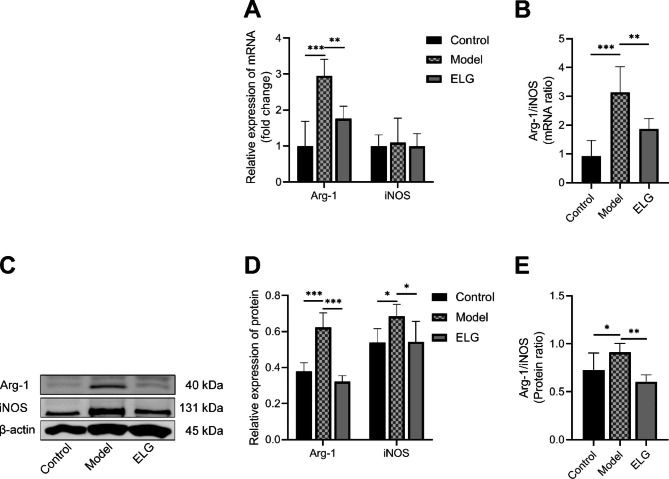
Fig. 5.
ELG inhibited M2-type polarization of macrophages in gastric antrum tissue of rats with PLGC. (A) The Arg-1 and iNOS mRNA expression of all groups (n = 6). (B) The ratio of Arg-1 mRNA to iNOS mRNA representing the M2-type polarization of macrophages (n = 6). (C-D) The Arg-1 and iNOS protein expression of all groups was detected by WB (n = 6). (E) The ratio of Arg-1 protein to iNOS protein representing the M2-type polarization of macrophages (n = 6). Data were represented by the mean and standard deviation, one-way ANOVA. Differences with P < 0.05 were considered statistically significant. *P < 0.05, **P < 0.01, ***P < 0.001

