Fig. 1.
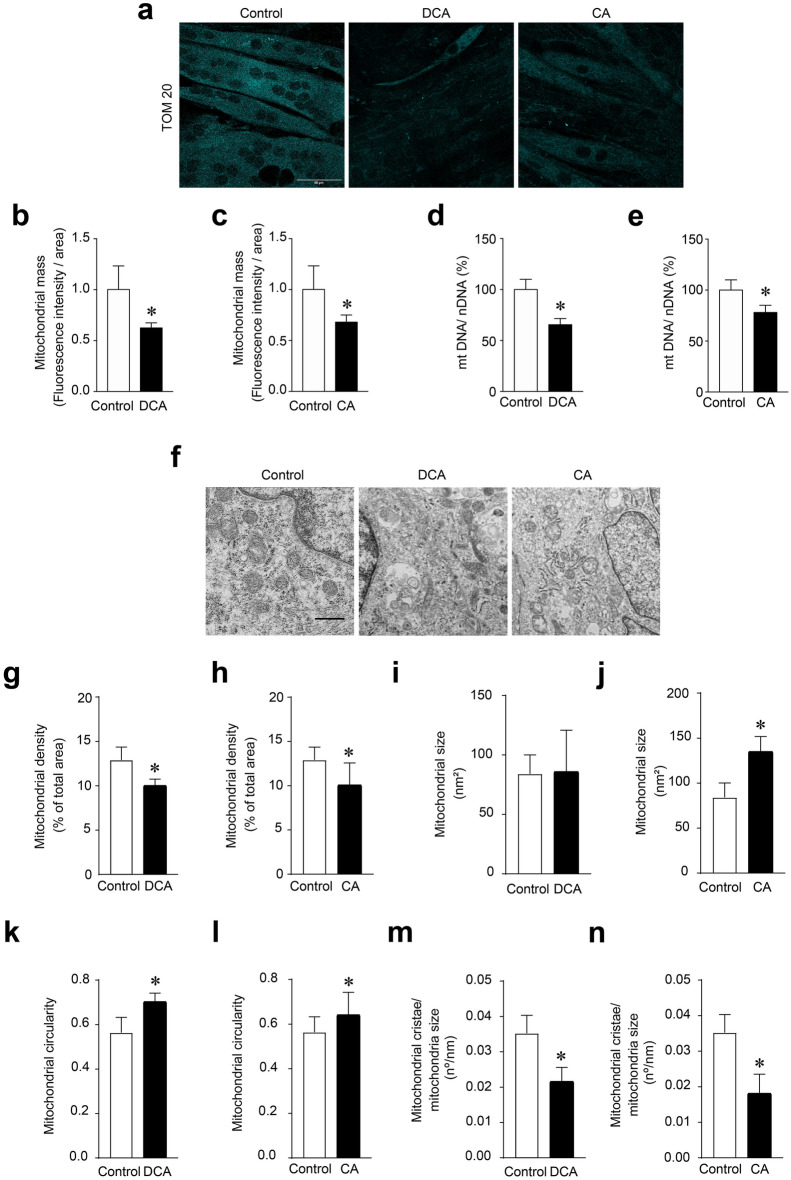
DCA and CA decrease mitochondrial mass in C2C12 myotubes. Differentiated C2C12 cells forming myotubes were incubated with 120 μM of DCA or 500 μM of CA for 72 h. When the treatment was finished, indirect immunofluorescence for TOM20 was performed. a Representative images for TOM20. Three independent experiments were quantified with four fields of view (areas) analyzed in 25–30 myotubes per condition per each separate experiment. b–c Analysis of TOM20 immunostaining to quantify mitochondrial mass under DCA (b) and CA (c) treatment expressed as fold of change. (d–e) mtDNA and nuclear DNA (nDNA) were determined and expressed as percentages. Quantified mtDNA, normalized by nDNA, in myotubes incubated with DCA (d) or CA (e). f Representative images of mitochondrial from C2C12 myotubes. Scale bar: 500 μm. For each independent experiment was analyzed the cell mitochondria of at least three fields in four myotubes and were counting 6–8 mitochondria per field. g, h Determination of mitochondrial density after DCA (g) and CA (h) treatment was expressed as a percentage of total cellular area. i, j Mitochondrial size in nm2 was calculated in myotubes incubated with DCA (i) or CA (j). k, l Mitochondrial circularity was determined as width/lengthy ratio for DCA (k) or CA (l) treatment. m, n Finally, the number of mitochondrial cristae was normalized by mitochondria size after incubation with DCA (m) and CA (n). Values correspond to the mean ± SEM (n = 3 independent experiments for fluorescence microscopy and mtDNA, and n = 4 independent experiments for electron microscopy, *p < 0.05. t-test)

