Fig. 3.
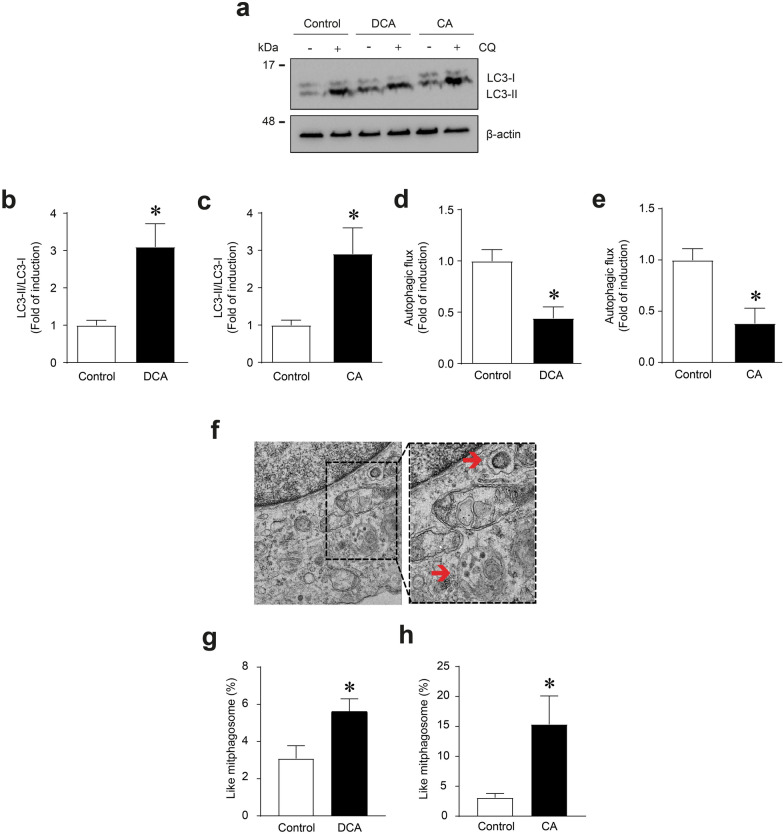
DCA and CA decrease autophagic flux in C2C12 myotubes. C2C12 myotubes were incubated with 120 μM of DCA or 500 μM of CA for 72 h. To block the autophagy process, 8 h before finishing the experiment, the myotubes were co-treated with chloroquine (CQ; 50 μM). a When the treatment was completed, we evaluated LC3I and LC3II protein levels through Western blot. β-actin levels are shown as the loading control. Molecular weight markers are depicted in kDa. b–c The results were represented as the LC3II/LC3I ratio and expressed as the mean ± SEM (fold of change) in myotubes incubated with DCA (b) and CA (c). d–e The quantitative analysis of autophagic flux was conducted using densitometric analysis of LC3II levels obtained by comparing the difference between the condition with and without CQ from the representative images shown in (a). f Representative pictures of mitophagosome-like structures from C2C12 myotubes. Scale bar: 500 μm. For each independent experiment was analyzed the cell mitochondria of at least three fields in four myotubes and were counting 6–8 mitochondria per field. g, h The percentage of mitophagosome-like structures observed in myotubes after DCA (g) or CA (h) treatment was calculated. The values were expressed as the mean ± SEM (n = 3 independent experiments for immunoblotting, and = 4 independent experiments for electron microscopy, *p < 0.05. t-test)

