Fig. 7.
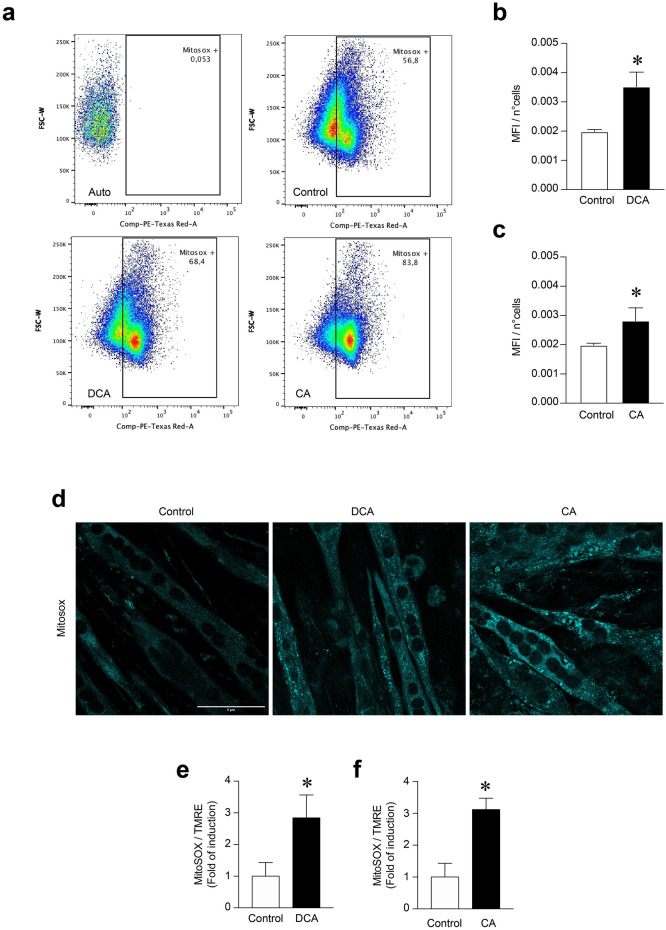
Increased mitochondrial ROS levels induced by DCA and CA in C2C12 myotubes. C2C12 myoblasts were differentiated for 5 days until forming myotubes. Then, cells were incubated with 120 μM of DCA or 500 μM of CA for 72 h. Further, myotubes were incubated with 10 μM or 5 μM of MitoSOX probe for flow cytometry and fluorescence microscopy analysis, respectively. a Representative flow cytometry dot plot analyses to identify mean fluorescence intensity (MFI) for each condition. b–c Analysis of the MFI normalized by the number of cells (n°cells) in myotubes incubated with DCA (b) or CA (c). Values are expressed as the mean of MFI/n°cells ± SEM (n = 3 independent experiments, *p < 0, 05. t-test). (d) Representative images for the MitoSOX signal. , f) Analysis of the MitoSOX fluorescence normalized by TMRE signal in myotubes incubated with DCA (e) or CA (f). Scale bar: 5 μm. Values are expressed as a fold of induction and correspond to the mean ± SEM (n = 3 independent experiments, *p < 0.05. t-test)

