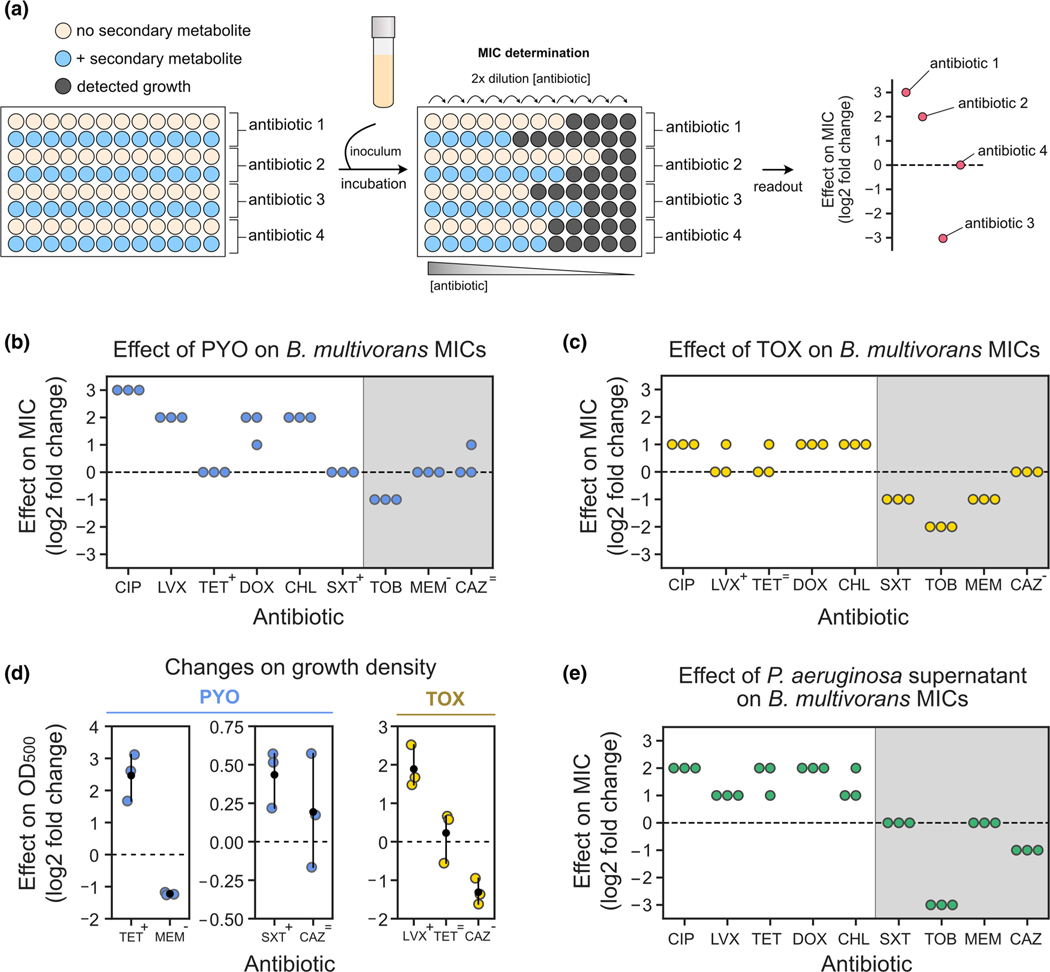
FIGURE 4.
Assessing the effects of secondary metabolites on antimicrobial susceptibility testing. (a) Experimental design used during MIC tests that account for the effect of secondary metabolites on resistance levels. (b) Effects of PYO (100 μM) on Burkholderia multivorans 1 MICs (for each antibiotic, n = 3). (c) Effects of TOX (50 μM) on B. multivorans 1 MICs (for each antibiotic, n = 3). In b and c, symbols above the antibiotic names represent the effects of PYO and TOX on growth density displayed in D (“+” represents increase in density, “-” represents decrease in density, and “=” represents no consistent change in density). (d) Effects of PYO (two plots on the left) and TOX (right) on the growth density at the pre-MIC antibiotic concentrations during MIC assays. Antibiotics shown are the ones previously highlighted by the symbols in panels b and c. Note that scales are different for each plot. For normalized absorbance values, see Figure S11a,b. (e) Effects of Pseudomonas aeruginosa WT supernatant (i.e., PYO present) on B. multivorans 1 MICs (for each antibiotic, n = 3). For experimental design, see Figure S10b. Gray shading in b, c, and e represent antibiotics for which metabolite-mediated increase in resilience was not observed under the studied conditions. In panels d, the black dots mark the means and error bars represent 95% confidence intervals. CIP, ciprofloxacin; LVX, levofloxacin; TET, tetracycline, DOX, doxycycline, CHL, chloramphenicol, SXT, sulfamethoxazole/trimethoprim; TOB, tobramycin; MEM, meropenem; CAZ, ceftazidime.

