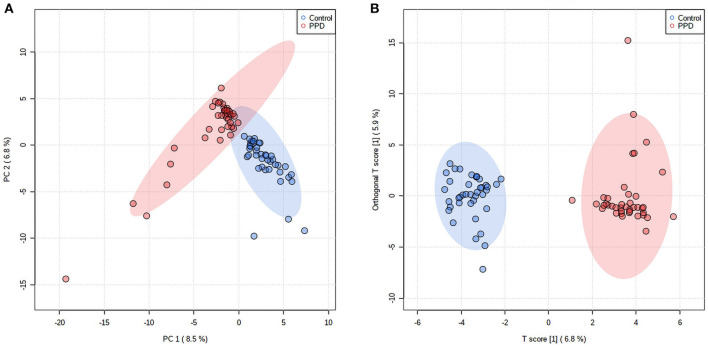
Figure 2.
Difference in gut microbiota composition in PPD patients and healthy controls. Each point represents the microbiota of each subject, and each group of subjects was labeled with a different color. The ellipses display 95% confidence regions. (A) PCA, PC1 = 8.5%, PC2 = 6.8%. (B) OPLS-DA, T score = 6.8%, Orthogonal T-score = 5.9%.

