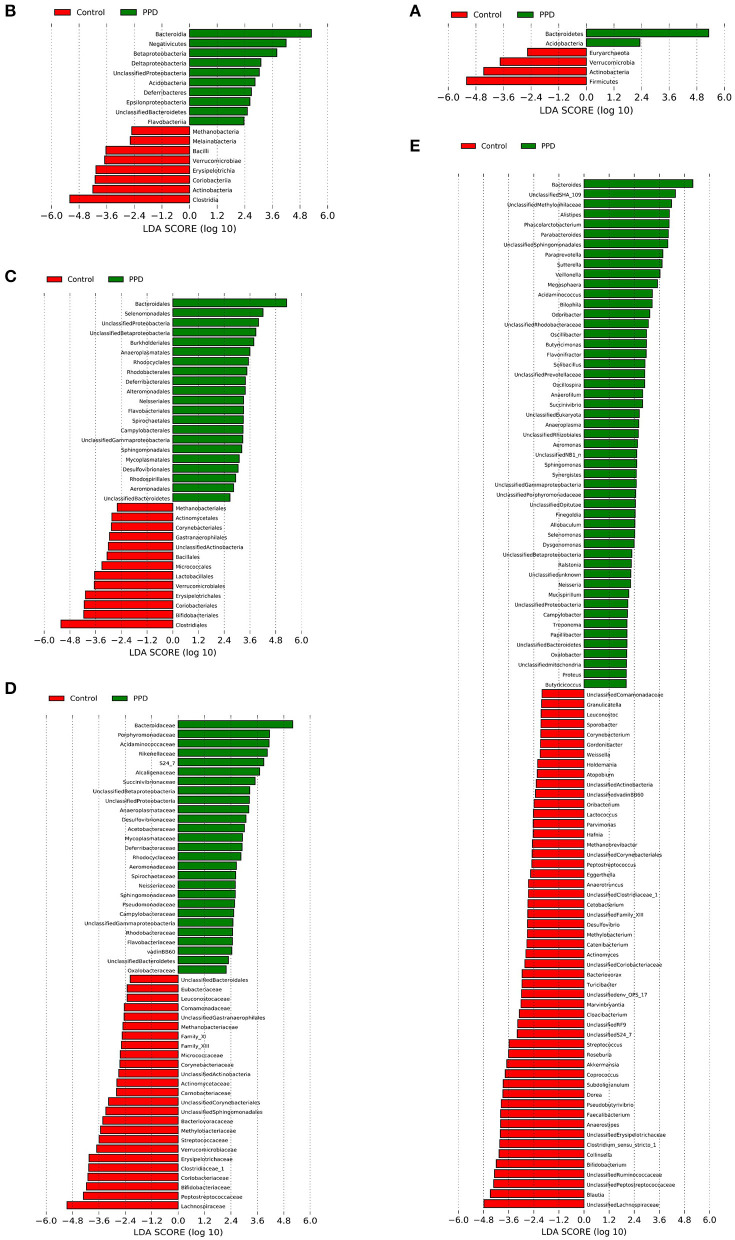
Figure 5.
LEfSe analysis revealed diverse intestinal flora taxa and species between PPD patients and healthy controls (LDA score > 2, p < 0.05). (A–E) Classification levels of phylum, class, order, family, and genus. The graph was generated using the LEfSe program. Red, healthy control. Green, PPD patients.

