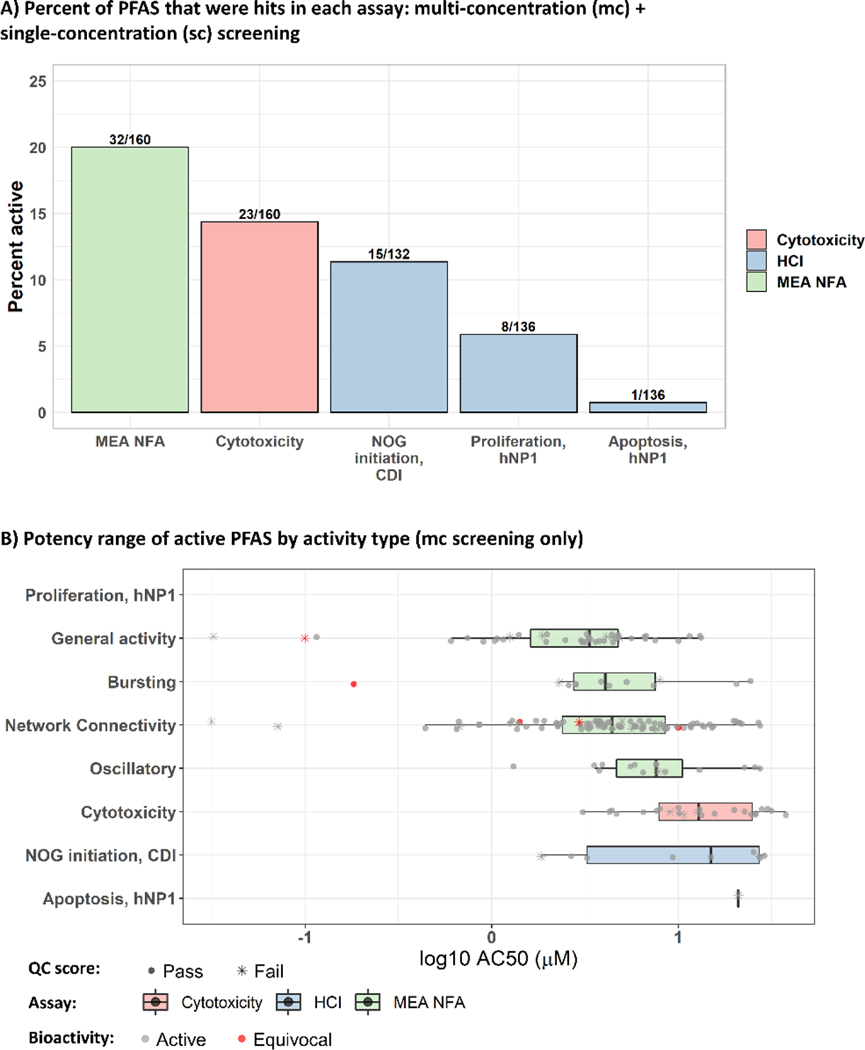
Figure 1:
DNT NAMs activity by assay and activity types
A: The percentage of active PFAS in mc and sc screening by neurodevelopemntal process (MEA NFA, NOG, apoptosis, and proliferation). The fraction represents the total number of active PFAS/ the total number of PFAS screened in the assay. B: The potency range of bioactivity by activity type, with median and interquartile range shown in a boxplot. Superimposed data points (represented by the boxplot) denote the concentration at 50% maximal activity for each positive hit-call in the mc screening (log10 AC50 (μM)). The legend indicates the assay technology for each group. Cytotoxicity includes all measurements of cytotoxicy from each assay in the battery. MEA NFA: microelectrode array network formation assay, HCI: high content imaging, NOG: neurite outgrowth assay.The shape of the data points corresponds to the QC results of “Pass” (dot) or “Fail” (asterisk) and the color corresponds to the bioactivity determination of “Active” (gray) or “Equivocal” (red).

