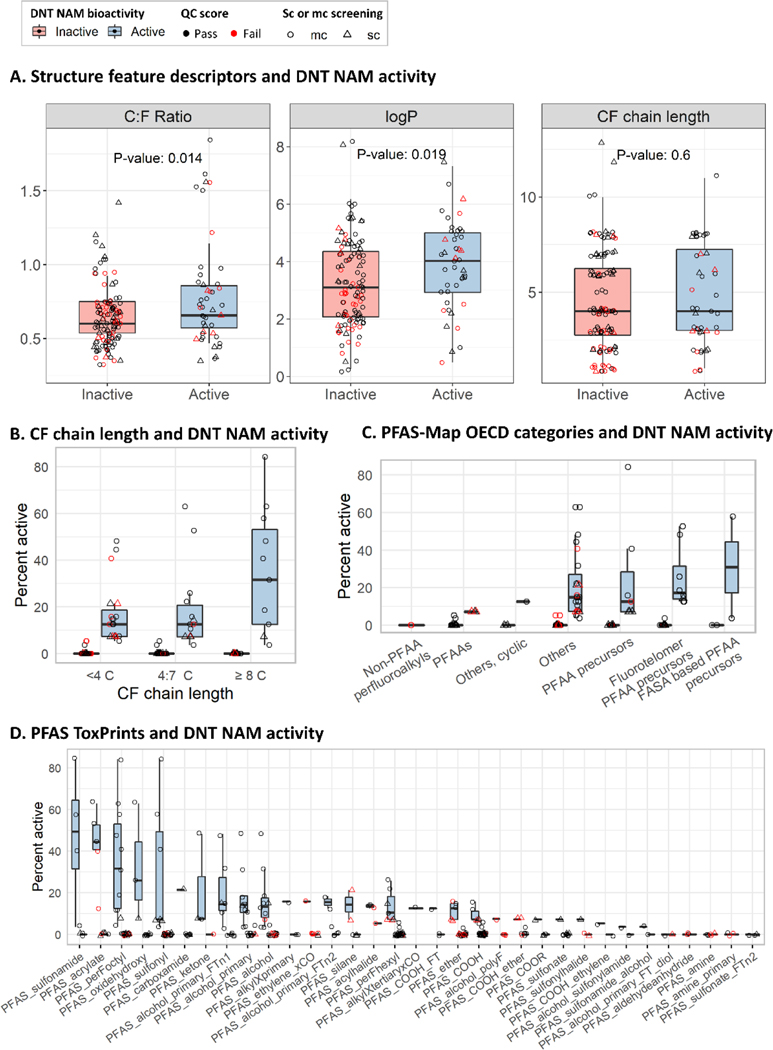
Figure 3:
Chemical and structure feature descriptors and DNT NAMs activity
Box plots showing trends in PFAS sc and mc activity in the DNT NAMs battery and chemical and structure feature descriptors. An ‘active’ (blue boxplot fill) was defined as a chemical that demonstrated a positive response in at least one endpoint in either sc or mc screening (triangle or circle shapes, respectively). An ‘inactive’ (red boxplot fill) includes chemicals demonstrating no activity or equivocal activity. Box plots indicate the median, lower 25th percentile, and upper 75th percentile. Data point color indicates QC testing results; pass (black), fail (red). A: The C:F ratio, logP, and CF chain length were compared between inactive and active PFAS with a Student’s T-test for significance (p< 0.05). The percent activity of each chemical in the battery (number of positive hit-calls/ number of tested endpoints *100) were plotted against B: the CF chain length, binned into three groups (<4 C, 4:7 C, and ≥8 C), C: the PFAS-map OECD structure categories, and D: PFAS ToxPrints.

