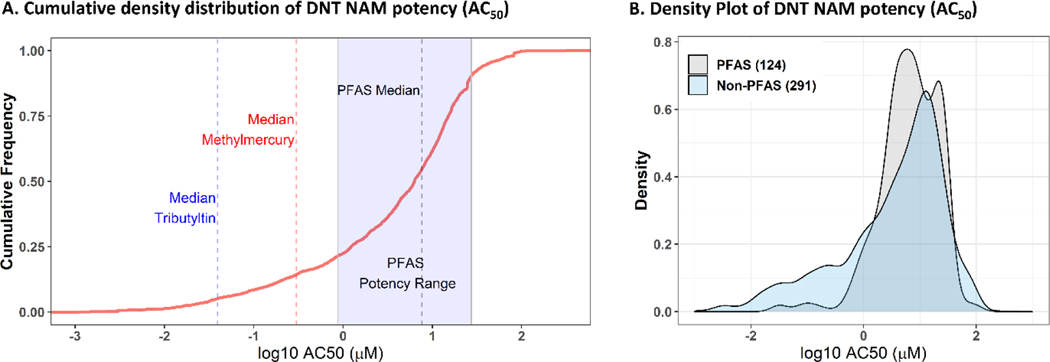
Figure 4:
PFAS bioactivity compared to all available chemicals tested in the DNT NAMs battery.
A: A cumulative density distribution plot of potencies (AC50) from all available DNT NAMs data (415 chemicals, red line) compared to the distribution of the median PFAS potency (blue rectangle with a minimum x-axis value of the 5th %-ile PFAS AC50 and a maximum x-axis value of the 95th %-ile PFAS AC50) compared to the average potency of two known neurodevelopmental toxicants, methylmercury (blue dotted line) and tributyltin (red dotted line). B: A density plot comparing active PFAS potencies (AC50) (gray) to all other active non-PFAS chemicals (a total of 291 chemicals) in the DNT NAMs battery (blue). The x-axis units are in log10-μM.

