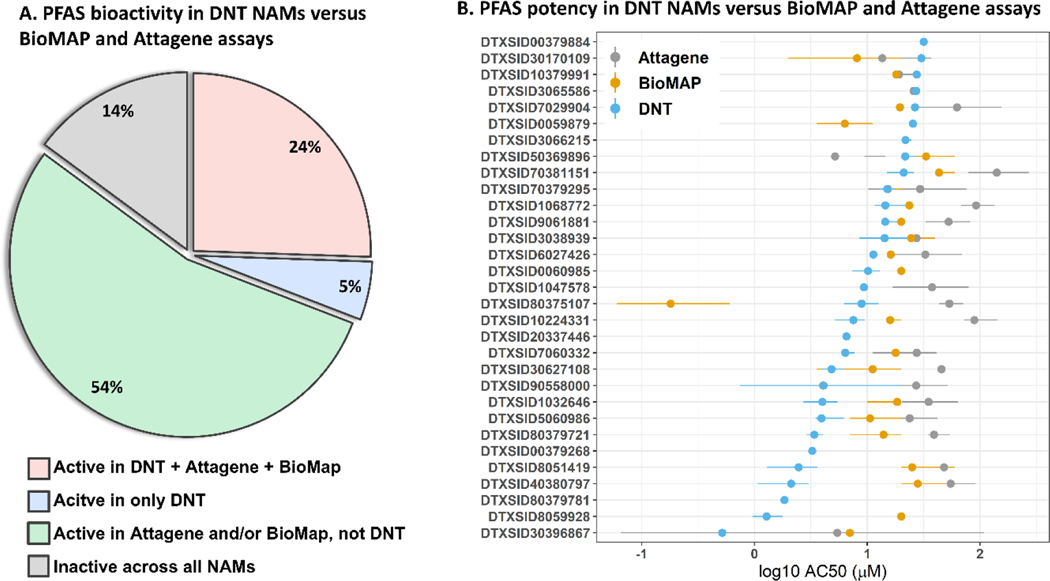
Figure 5.
PFAS potency in the DNT NAMs as compared to the potency in the BioMAP and Attagene assays.
A: The pie chart shows the percent of PFAS that were active in only the DNT NAMs compared to BioMAP and Attagene assays. B: The data indicate the mean AC50 values for PFAS that were active across all three assays (Attagene, BioMAP, or DNT NAMs). The lines indicate the lower (0.25) and upper (0.75) quantile bounds.

