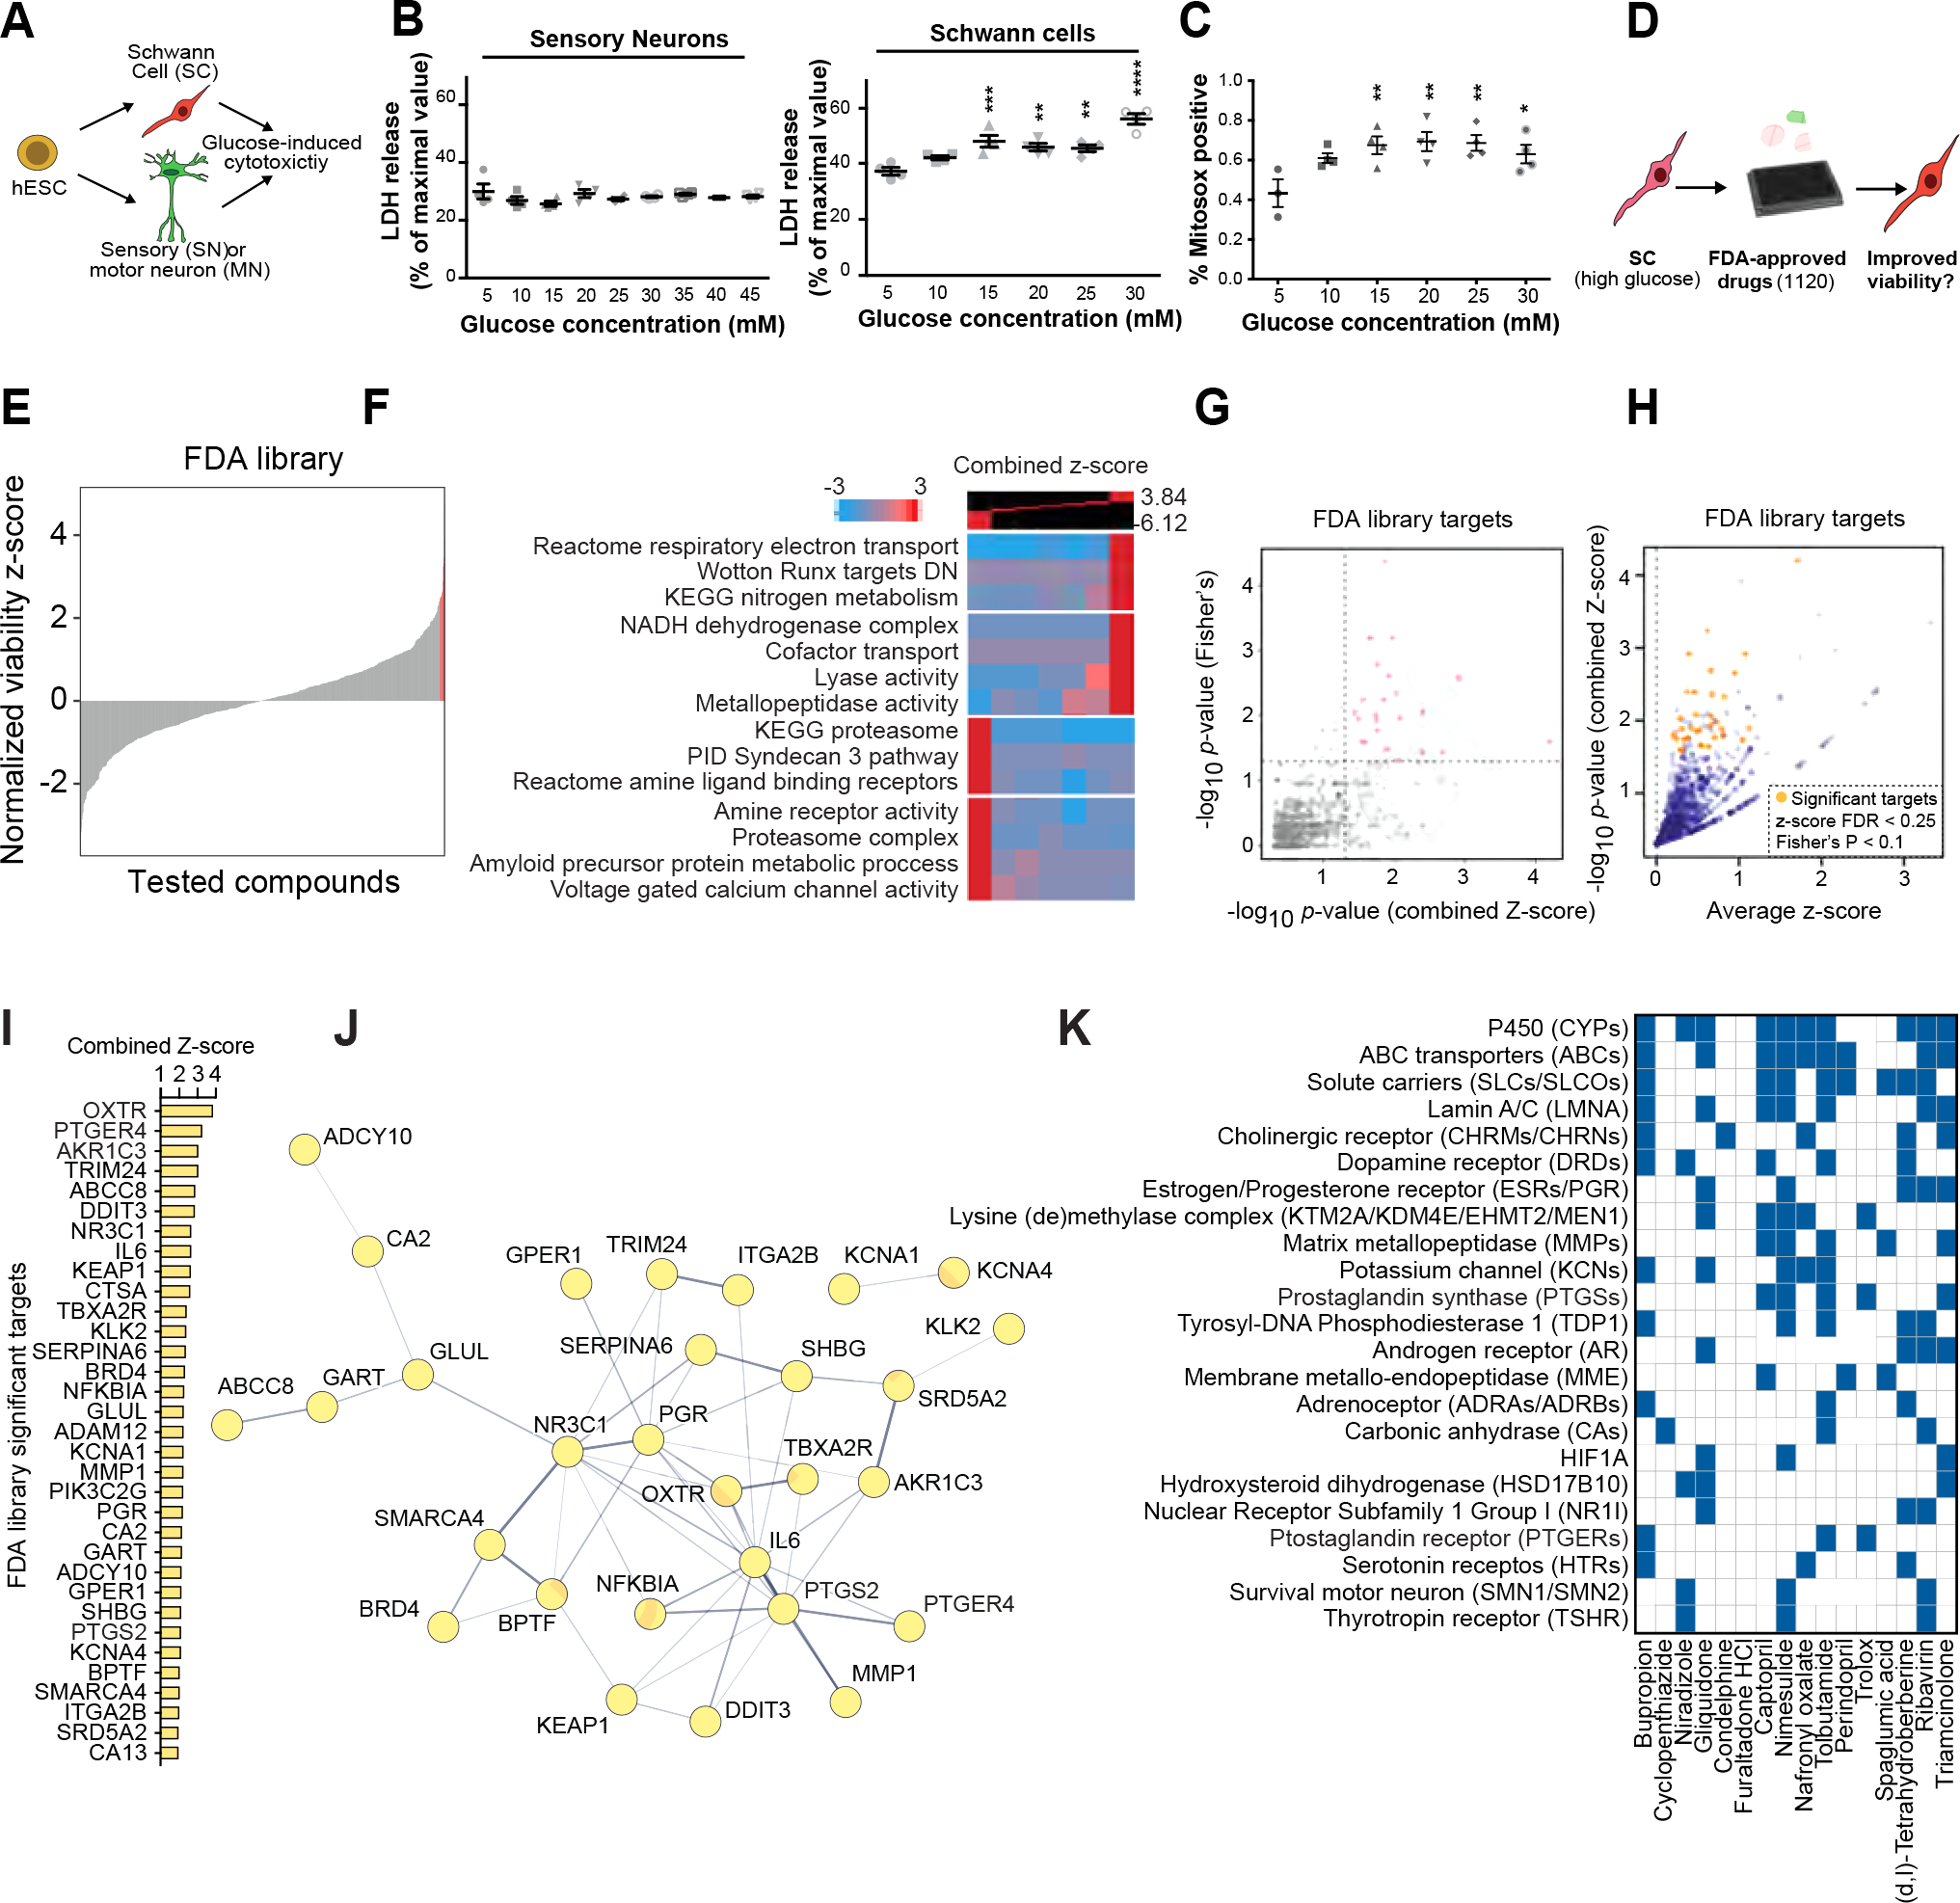
Figure 4: Schwann cells are selectively vulnerable to high glucose exposure.

A) Schematic of the experimental paradigm for modeling diabetic nerve damage.
B) Cytotoxicity analysis of SCs and sensory neurons at different glucose concentrations.
C) Oxidative stress measurement of SCs exposed to increasing concentration of glucose. Statistical analysis (one-way ANOVA) comparing to low glucose (5 mM) condition. ns, not significant. * p<0.05; ** p<0.01.
D) Schematic of high-throughput drug screening for identification of compounds that enhance the viability of high glucose-treated hPSC-SCs.
E) Presentation of the distribution of library compounds by their corresponding normalized viability z-score.
F) Gene-set enrichment analysis using iPAGE for the library compounds’ targets identifies GO terms associated with hits improving and worsening SC viability.
G) p-value correlation plot to identify significant drug targets. See methods for details.
H) One-sided volcano plot for all genes with positive z-scores. Gold: thresholds of combined z-score FDR<0.25 and Fisher’s p-value <0.1.
I, J) Identified target genes (gold in H) and their protein-protein interaction network (J).
K) Predicted targets of hits compiled from the following databases: BindingDB51, Carlsbad52, Dinies53, PubChem bioassays54, SEA32, Superdrug 255 and SwisTargetPrediction56.
