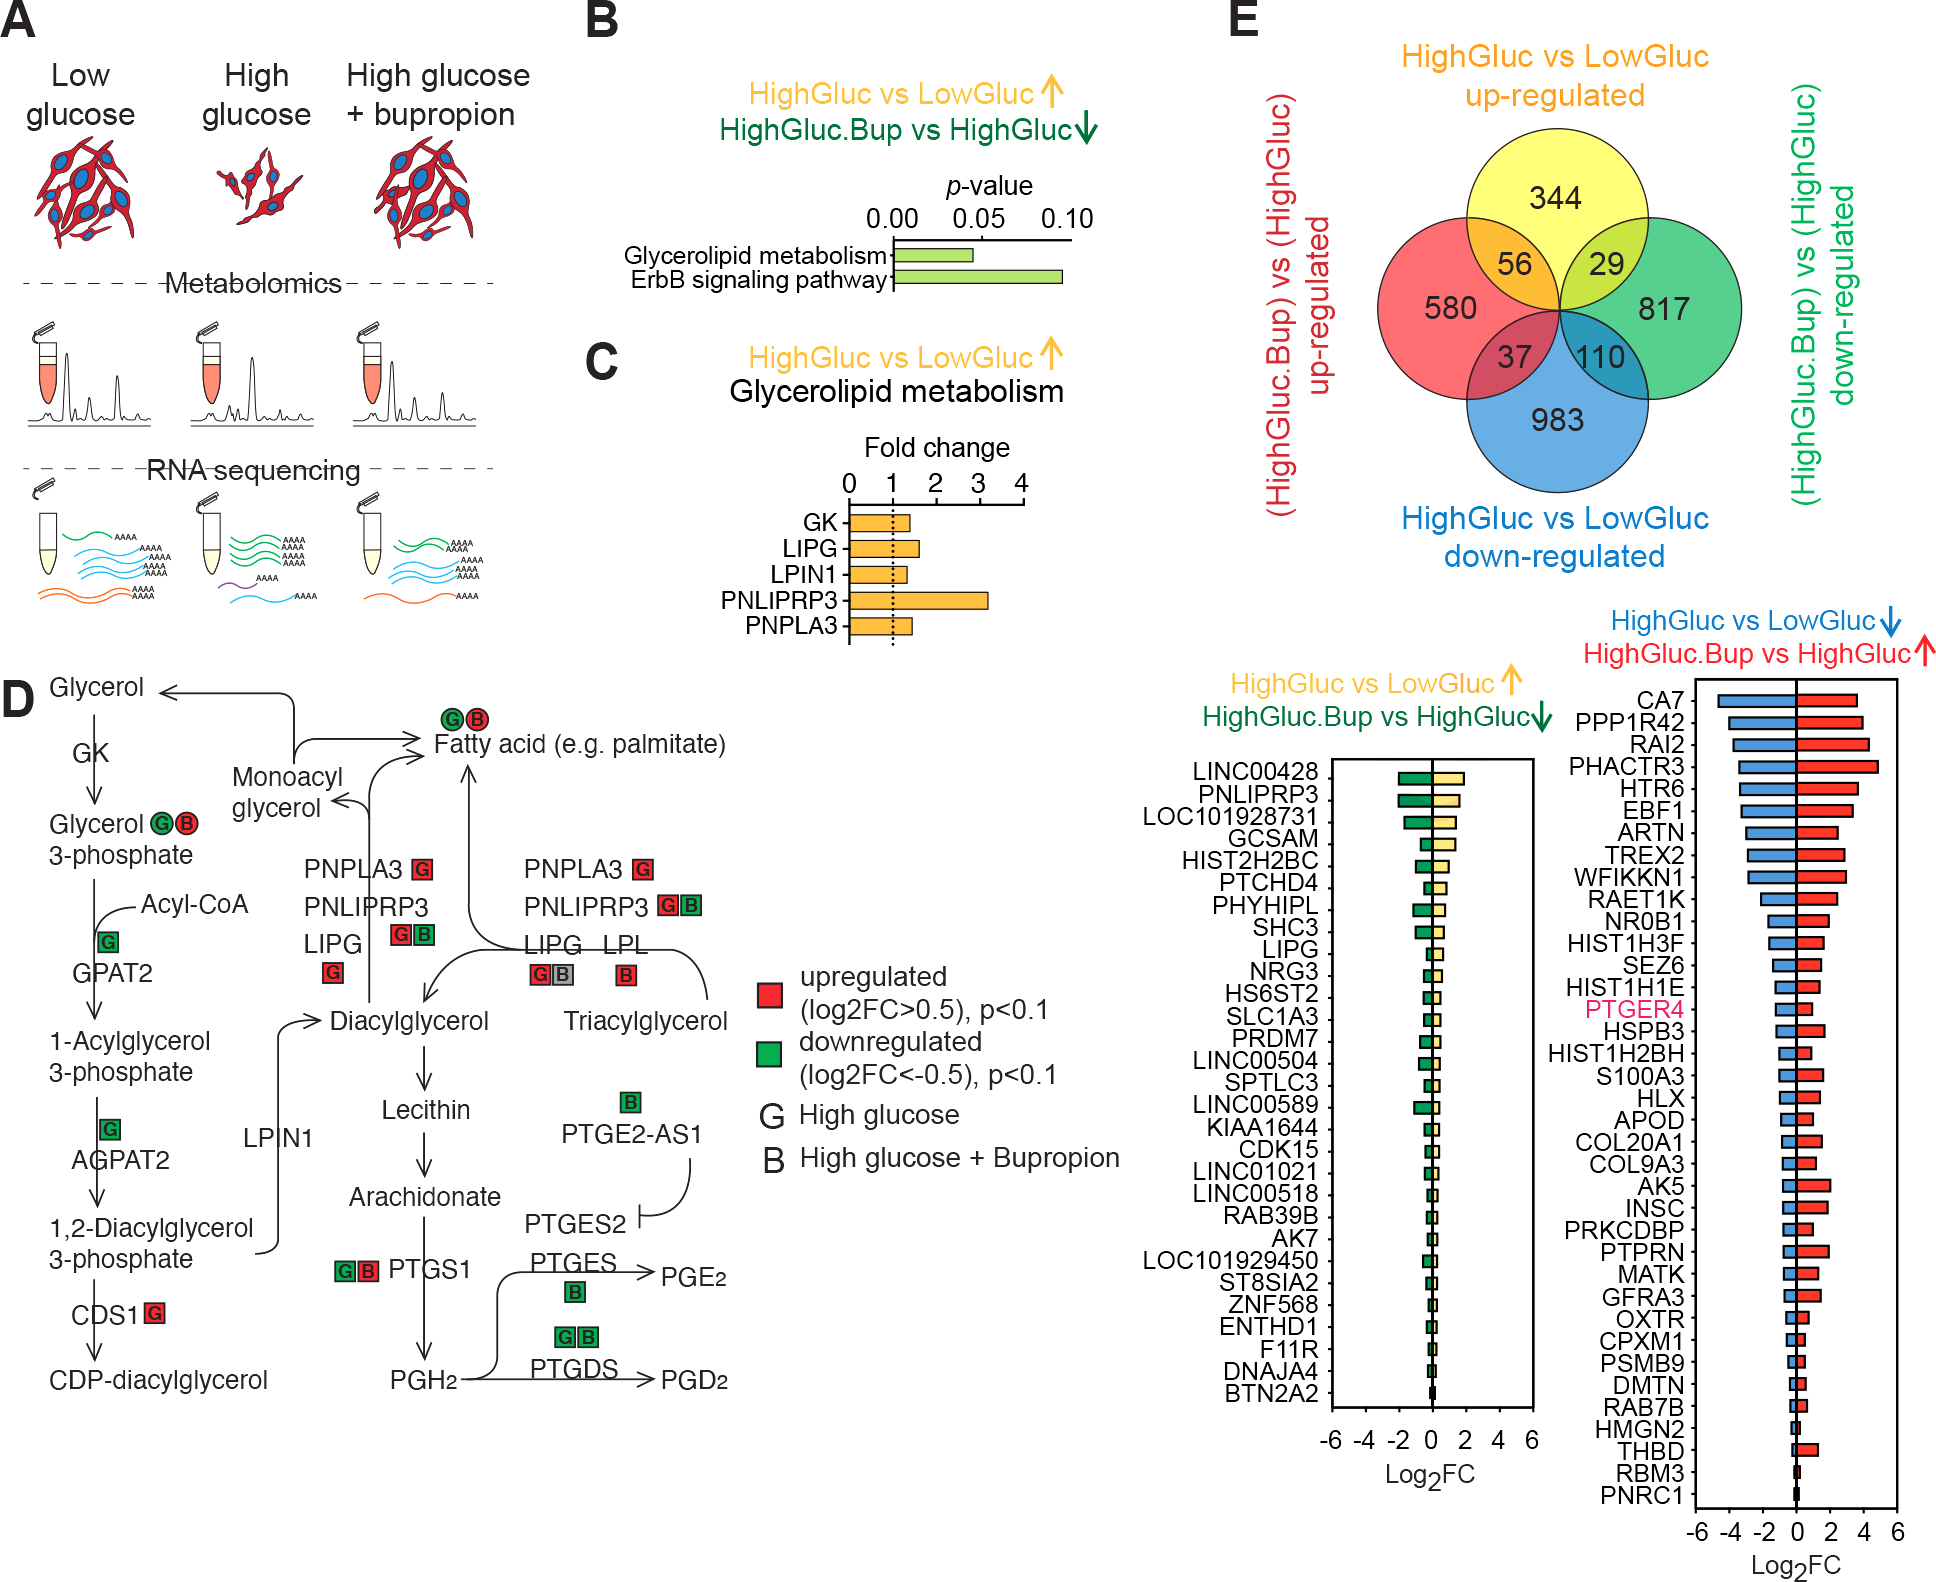
Figure 5: Bupropion treatment counteracts high-glucose induced molecular changes in Schwann cells.

A) Schematic of the unbiased metabolite and transcriptional profiling of differentially treated SCs.
B) Pathway enrichment analysis of genes upregulated in high glucose and downregulated upon BP treatment.
C) Glycerolipid metabolism enzymes upregulated in high glucose condition.
D) Glycerolipid metabolism schematic adopted from KEGG shows changes in the enzymes and metabolites in response to high glucose and BP treatments in SCs.
E) Venn diagram showing DEGs in SCs treated with high glucose, with or without BP (top). DEGs in hyperglycemia that show a reversed pattern of expression when treated with BP (bottom).
