
Fig. 1: Transcriptional signature of human CD8+ T cell subsets.
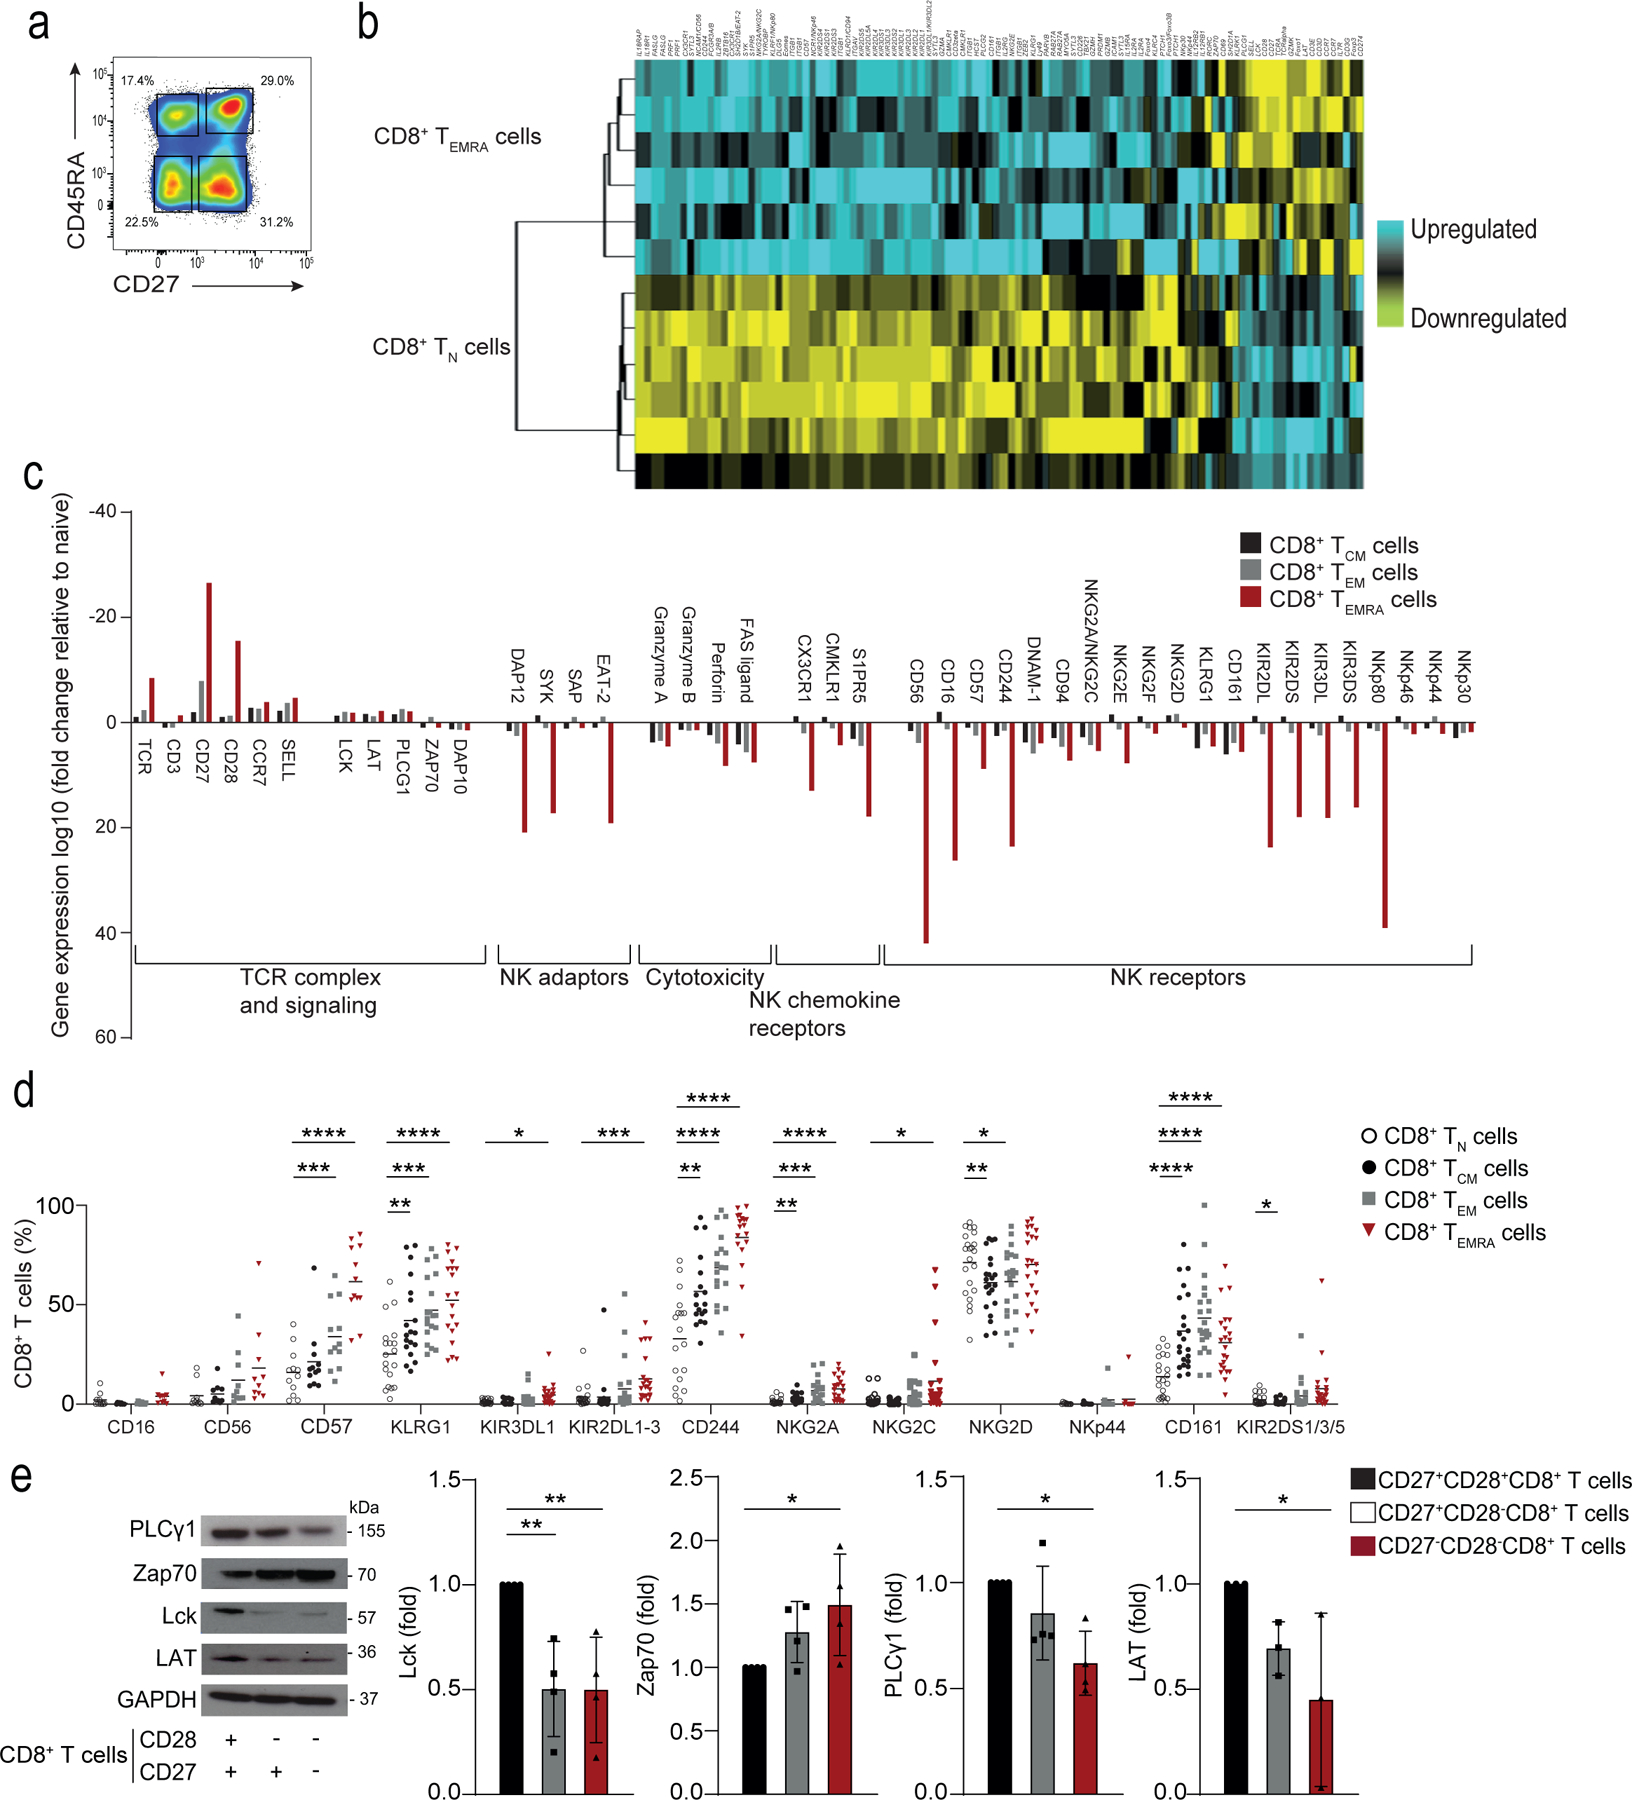
a) Representative image of CD8+ T cells gated on CD27+CD45RA+ TN cell, CD27+CD45RA− TCM cells, CD27−CD45RA−TEM cells, and CD27−CD45RA+TEMRA cells isolated from the PBMCs from 6 healthy donors. Numbers in gates represent percentages of cells in each subset from a representative donor. Similar results were obtained in other experiments. b) Heat map of gene expression of Affymetrix U133 plus 2 microarrays of sorted TN and TEMRA CD8+ T cell subsets, showing downregulated (in yellow) and upregulated genes (in blue). c) The relative fold-change (log10) of differentially expressed genes of interest in TCM, TEM and TEMRA CD8+ T cell subsets compared to TN CD8+ T cells. The list of genes of interest is shown in Supplementary table 2 and the complete list of differentially expressed genes from the whole-transcriptome analysis (≥2-fold change, p<0.05, FDR<0.05%) is available in Supplementary table 1. d) NKR expression TN, TCM, TEM, and TEMRA CD8+ T cells assessed by flow cytometry on PBMCs from 22 healthy donors (median age = 52, range 25–83). e) Representative immunoblots of proximal TCR components Lck, PLCγ1, LAT and Zap70 on CD27+CD28+, CD27+CD28− and CD27−CD28− CD8+ T cells freshly isolated from PBMCs using magnetic activated cell. Similar data were obtained in 4 independent experiments. Summary data (n = 4) of Lck, Zap70, PLCγ1 and LAT expression normalized to the loading control (GAPDH) and presented relative to the basal expression in CD27+28+CD8+ cells set to 1. d) Two-way ANOVA with Dunnett’s post-test correction and e) one-way ANOVA with Tukey’s correction (*p < 0.05, **p < 0.01, ***p < 0.001, ****p < 0.0001).