
Extended data 3: scRNA-seq method and quality control.
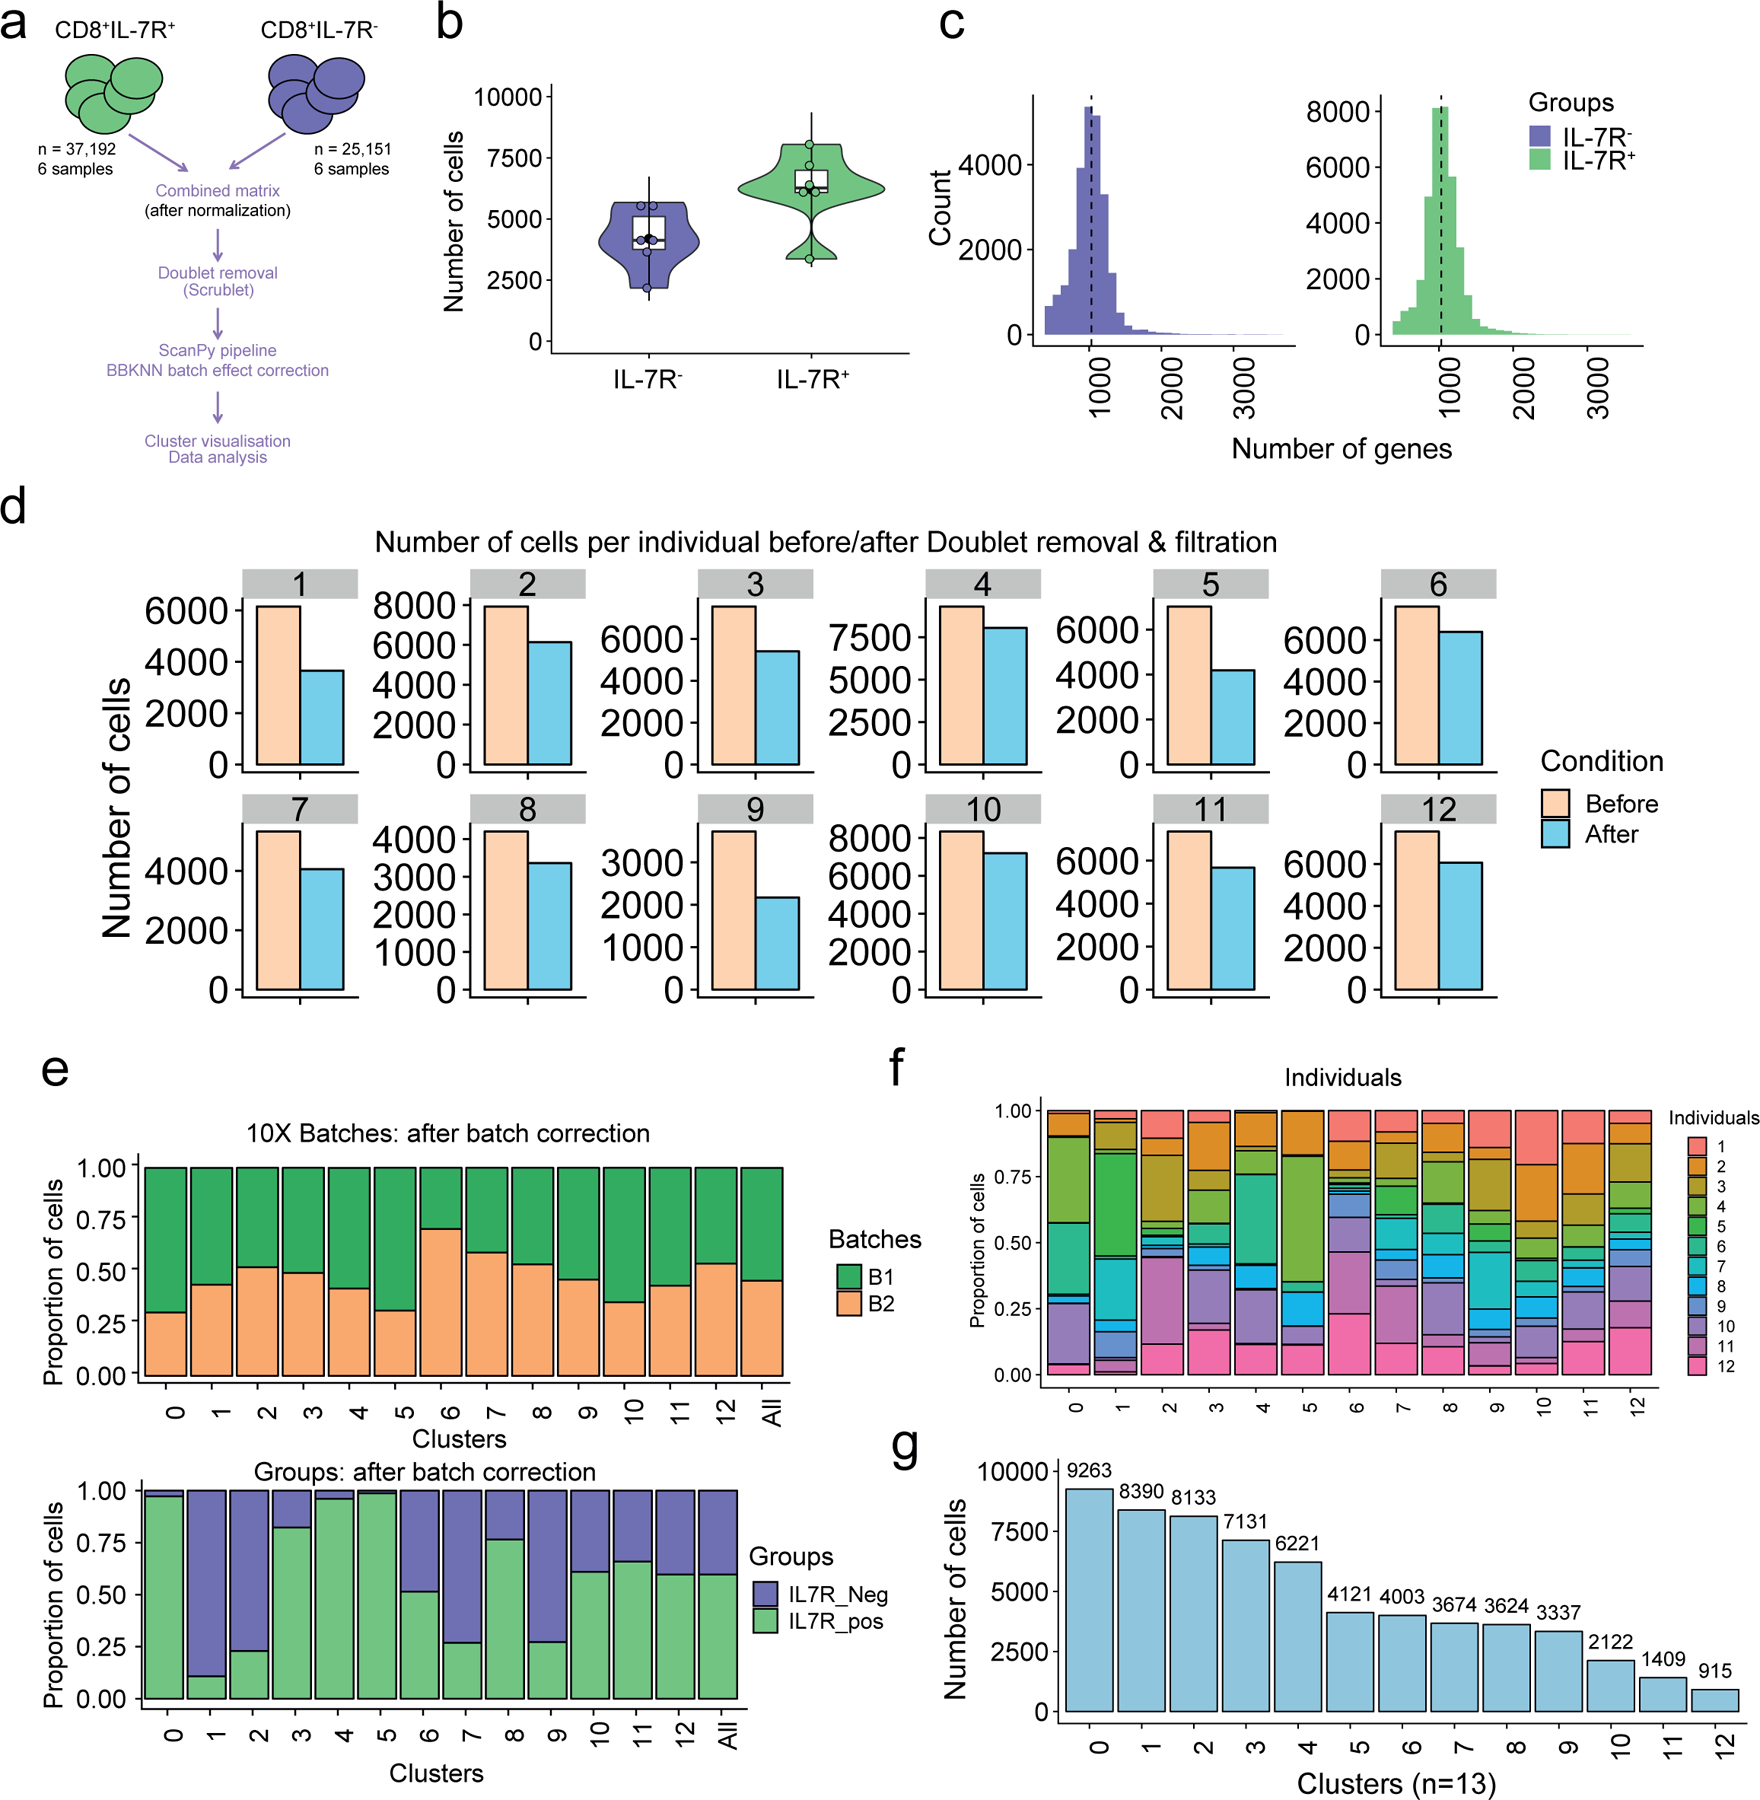
a) Overview of the scRNA-seq processing pipeline. Raw data (n=82,061 sorted CD8+ T cells) from six healthy older adult donors (six IL7R+ and six IL7R− CD8+ T cell samples) were first cleaned from the multiplets, using Scrublet36, then merged, resulting in a dataset containing 62,343 cells. After batch correction using BBKNN37, the Scanpy66 -based pipeline was ran (see Methods section). b) Number of cells per individual (n=12). IL7R+ (n=6, in green) and IL7R− (n=6; in purple). c) Number of genes per distribution across the IL7R+ (in green) and IL7R− (in purple) cells. d) Number of cells before (light orange) and after (light blue) filtration (i.e. doublet removal and other filtration steps that are described in Methods), within each individual. e) Bar plot highlighting the cell abundances across clusters (n=13) for 10X run batches (upper panel) and IL7R+ and IL7R− groups (lower panel) after BBKNN batch effect correction. f) Bar plot highlighting the individual (n=12) cell abundances across clusters (n = 13) after BBKNN batch effect correction. Each color represents an individual. g) Number of cells in each cluster.