
Extended data 4: scRNA-seq comparison of re-clustered CD8+ T cells.
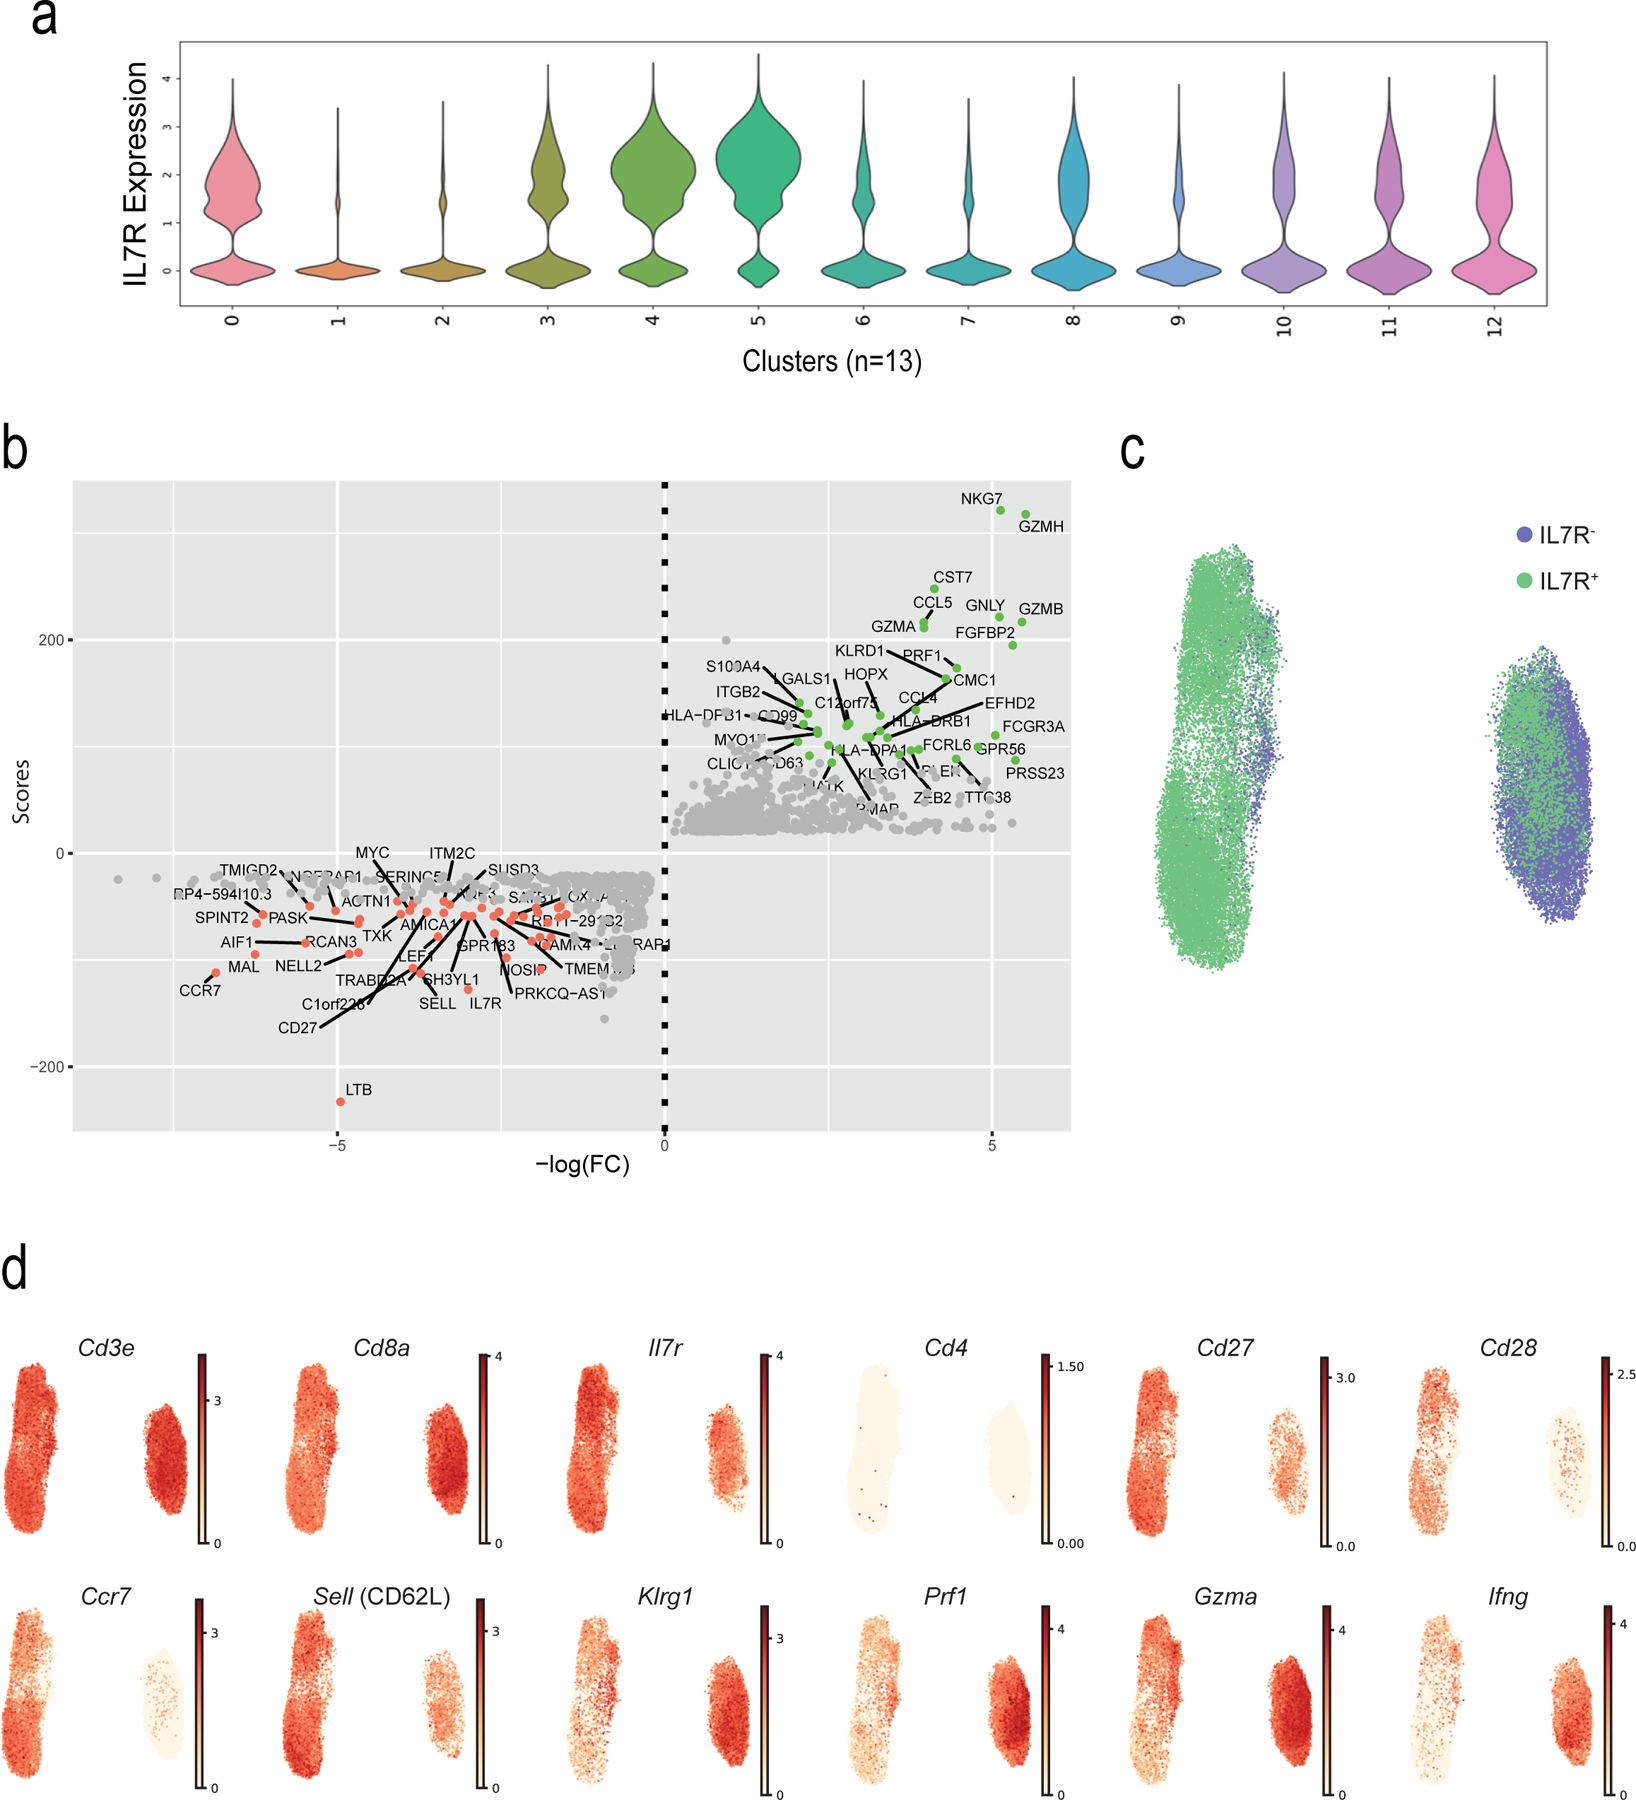
a) Violin plot showing the IL7R expression (as defined by scRNA-seq) across the 13 clusters. b) Dotplot showing the genes that are modulated in TN (top genes in red) and TEMRA (top genes in green) compartments. The scores (y-axis) were defined using the Scanpy function (sc.tl.rank_genes_groups), based on Wilcoxon statistical test. FC = Fold change. TN (C0, C4 and C8) and TEMRA (C1, C2 and C6) compartments were extracted, a second round of clustering on the selected clusters (n = 39,634) was performed (as in Fig. 3) and UMAP plots highlighting c) IL7R groups (IL7R+ in green, IL7R− in purple, as defined by flow sorting) and d) of representative genes are shown.