
Extended data 5: Extended data on cytotoxicity and Sesn2 expression.
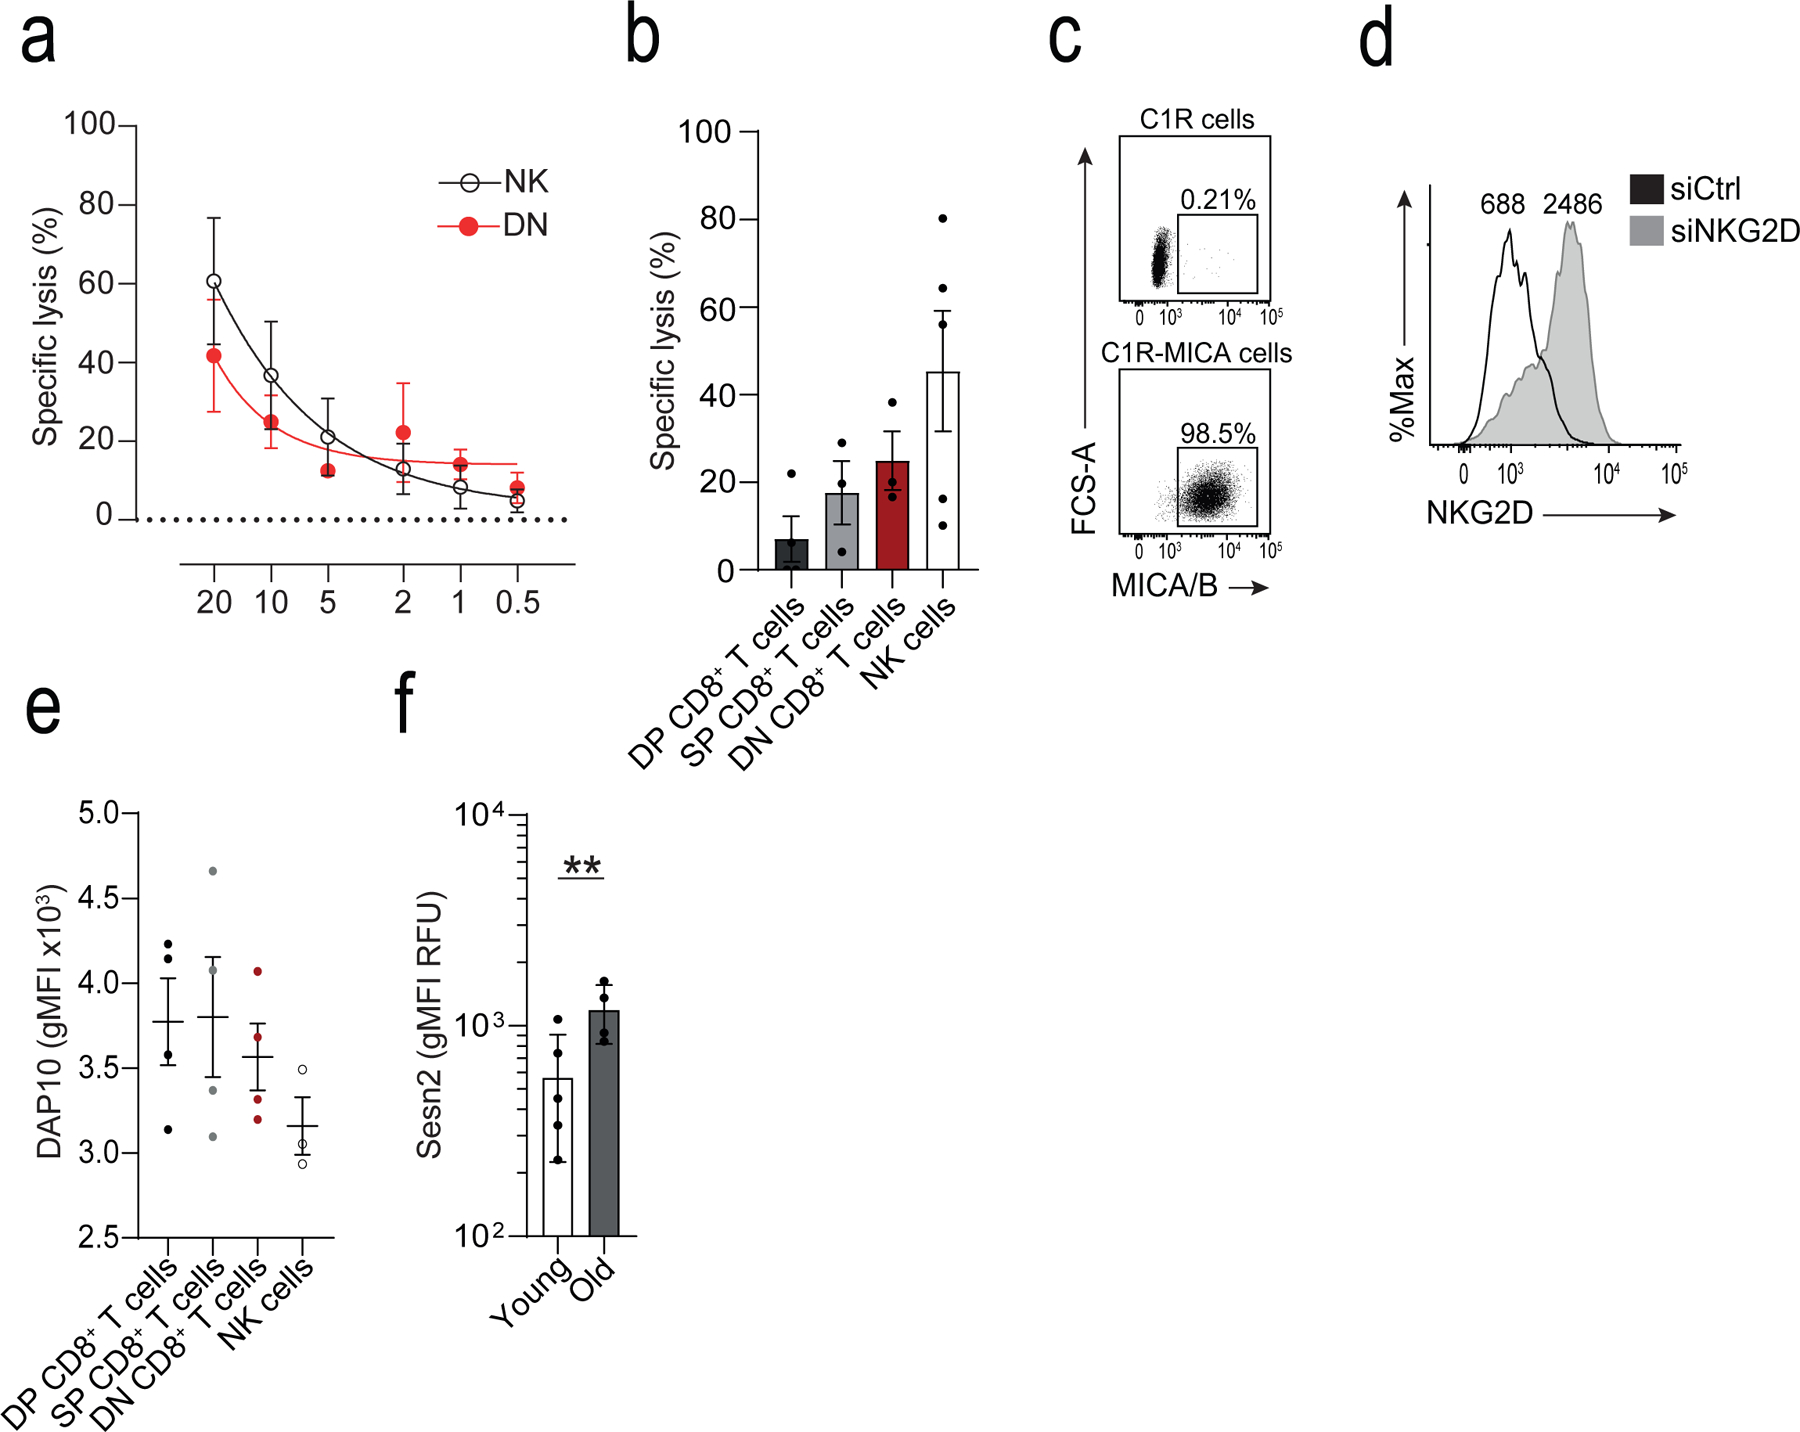
a) Titration curve of varying effector to target (E:T) ratios on cytotoxicity measured as specific lysis of K562 cells using a calcein-release of CD27−CD28−CD8+ (DN) T cells and NK cells isolated by FACS. Non-linear regression (5-parameter asymmetric) was performed (means and s.d., n = 3 donors). b) Calcein-release cytotoxicity assay of K562 cells by CD27+CD28+ (DP), CD27+CD28− (SP), DN CD8+ T cells, and NK cells at E:T 20:1. Cytotoxicity was assessed over a period of six hours (means and s.d., n = 3 donors). c) Representative dot plot of MICA/B expression in C1R and C1R-MICA*008 cells. d) Representative histogram of NKG2D expression on CD28−CD8+ T cells after transfection with NKG2D siRNA (siNKG2D, black) or scrambled siRNA (siCtrl, grey), determined 36 hours after transfection. Numbers indicate MFI. e) Expression of DAP10 on human NK cells, and DP, SP, and DN CD8+ T cell subsets. Mean fluorescence intensity is shown (means and s.d., n = 4 for T cell, n = 3 NK cells). f) Sestrin 2 on CD8+ T cells from young (<35 years, n = 5) and old (>65 years, n = 4) donors. MFIs are shown (geometric means and geometric s.d. factor). Two-tailed, unpaired Welch’s t test, ** p < 0.01.