
Extended data 7: Extended data on the murine delayed-type hypersensitivity model.
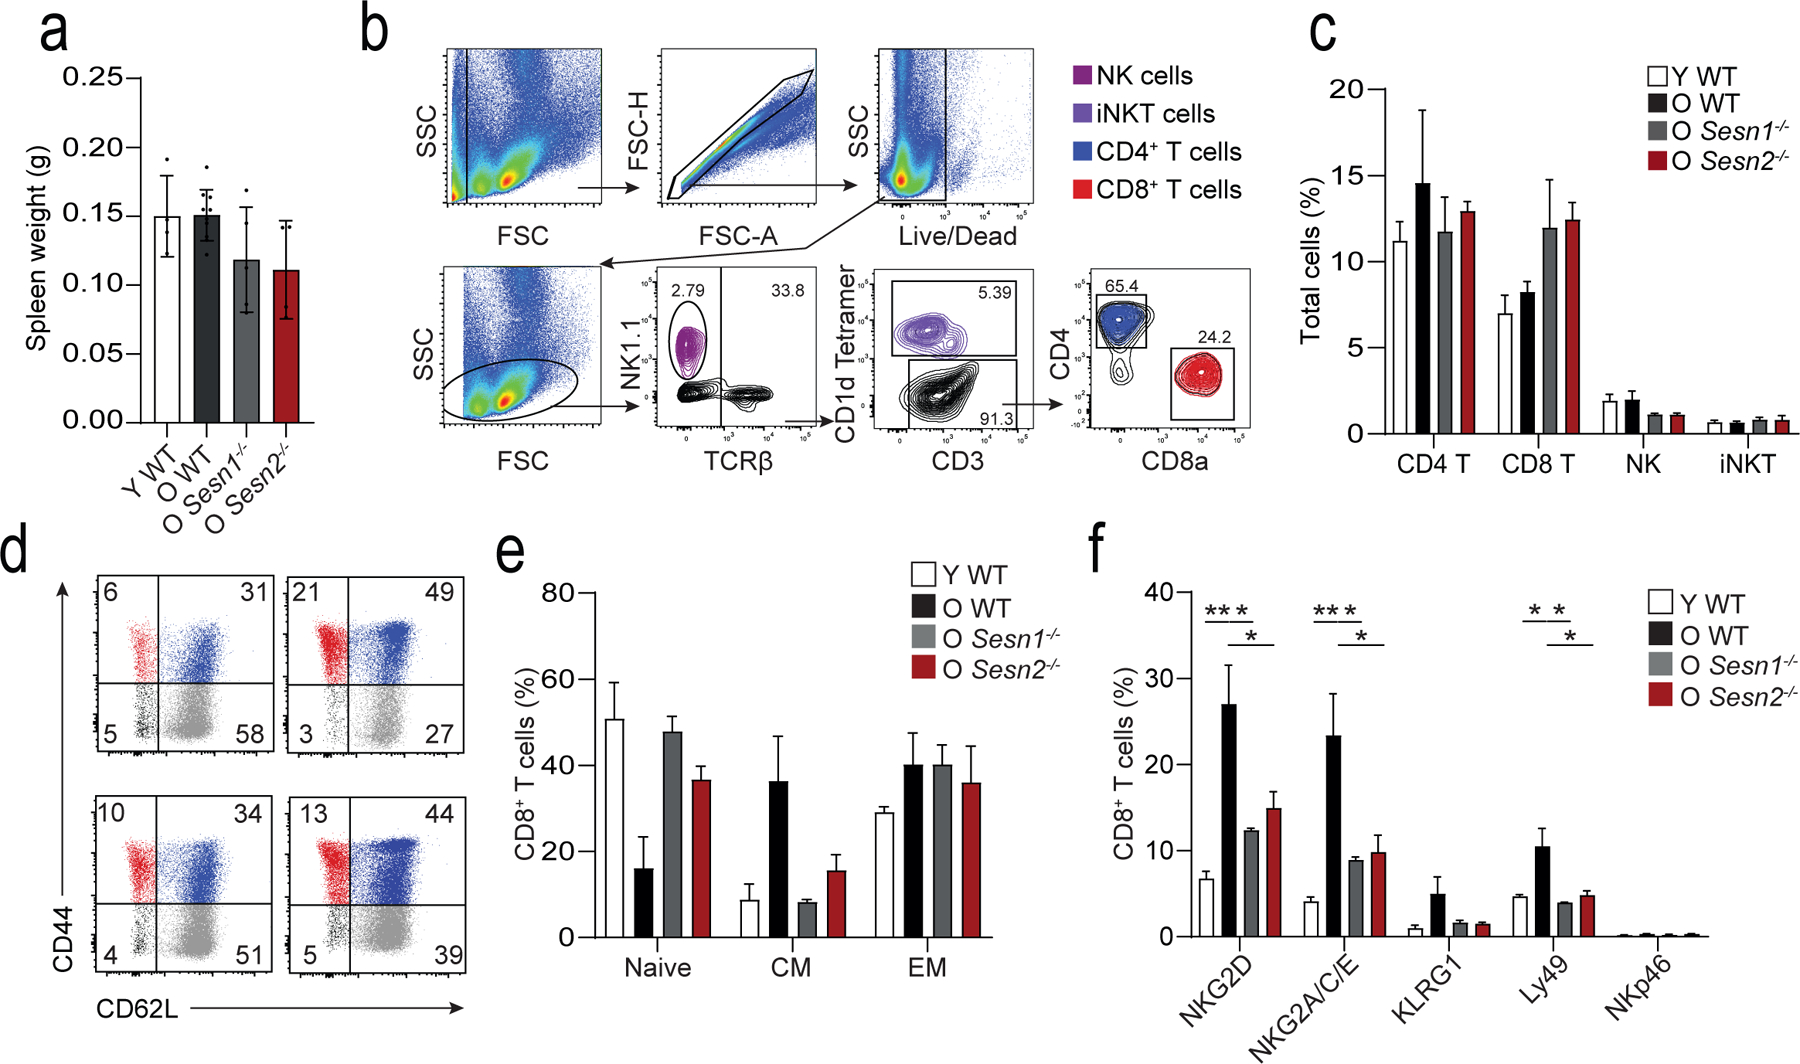
a) Spleen weight following mBSA-driven DTH response in young wild-type (Y WT, n = 4 mice), old wild-type (O WT, n = 8 mice), old Sesn1−/− (O Sesn1−/−, n = 5 mice), and old Sesn2−/− (O Sesn2−/−, n = 4 mice). Bars represent means and s.d.. b) Representative gating strategy to identify NK1.1+ NK cells (violet), TCRβ+CD1d tetramer reactive iNKT cells (purple), TCRβ+CD3+ CD4+ (blue) and CD8+ (red) T cells in mice. Similar results were obtained in all mice (n = 3 per group). c) Quantification of these cell types in the spleen (means and s.e.m., n = 3 mice per group). d) Dot plots showing relative frequencies of CD44−CD62L+ naïve (grey), CD44+CD62L+ central (blue), and CD44+CD62L− effector (red) CD8+ T cells. e) Quantification of these cell types as a proportion of total splenic CD8+ T cells (means and s.e.m., n = 3 per group). f) Enumeration of NKG2D, NKG2A/C/E, KLRG1, Ly49, and NKp46 expression on CD8+ T cells from Y WT, O WT, O Sesn1−/−, and O Sesn2−/− mice (means and s.e.m., n = 3 per group). One-way ANOVA with Tukey’s multiple comparisons test. * p < 0.05, ** p < 0.01, *** p < 0.001, **** p < 0.0001.