
Fig. 2: Single cell RNA-seq (scRNA-seq) of TN and TEMRA CD8+ T cells.
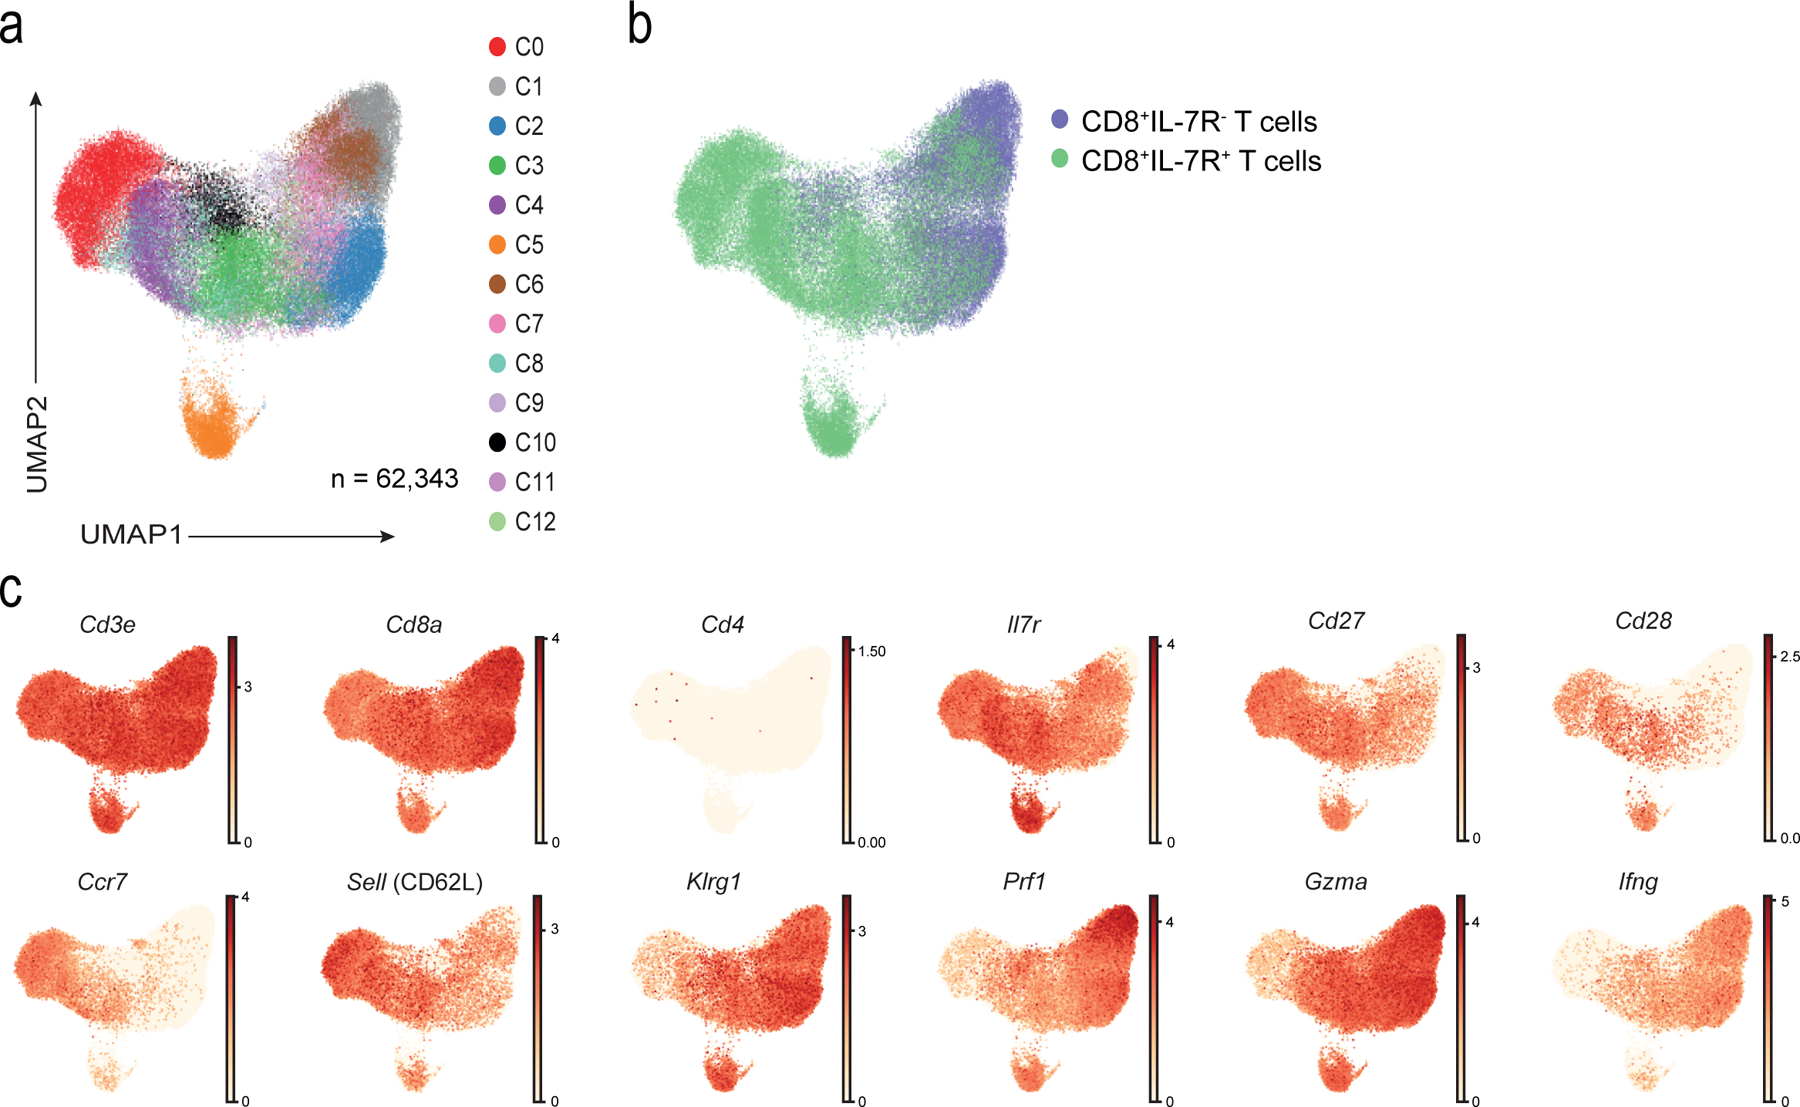
a) UMAP visualisation with clusters demarcated by colours identifying 13 CD8+ T cell clusters (C0 to C12) from RNA-seq analysis of single-cell sorted IL-7R+CD8+ (n = 37,192 single cells) and IL-7R−CD8+ (n = 25,151 single cells) T cells from six healthy older donors. b) UMAP plot from a) pseudo-coloured to show clustering of IL7-R+ (in green) and IL7-R− (in purple) CD8+ T cells as identified during sorting. c) UMAP plot from a) representing expression values of selected individual genes. Scales show low expression (yellow) to high expression (red). Other aliases or CD numbers of proteins encoded by the listed genes are shown in brackets.