
Fig. 3: NK and senescence markers within TN and TEMRA.
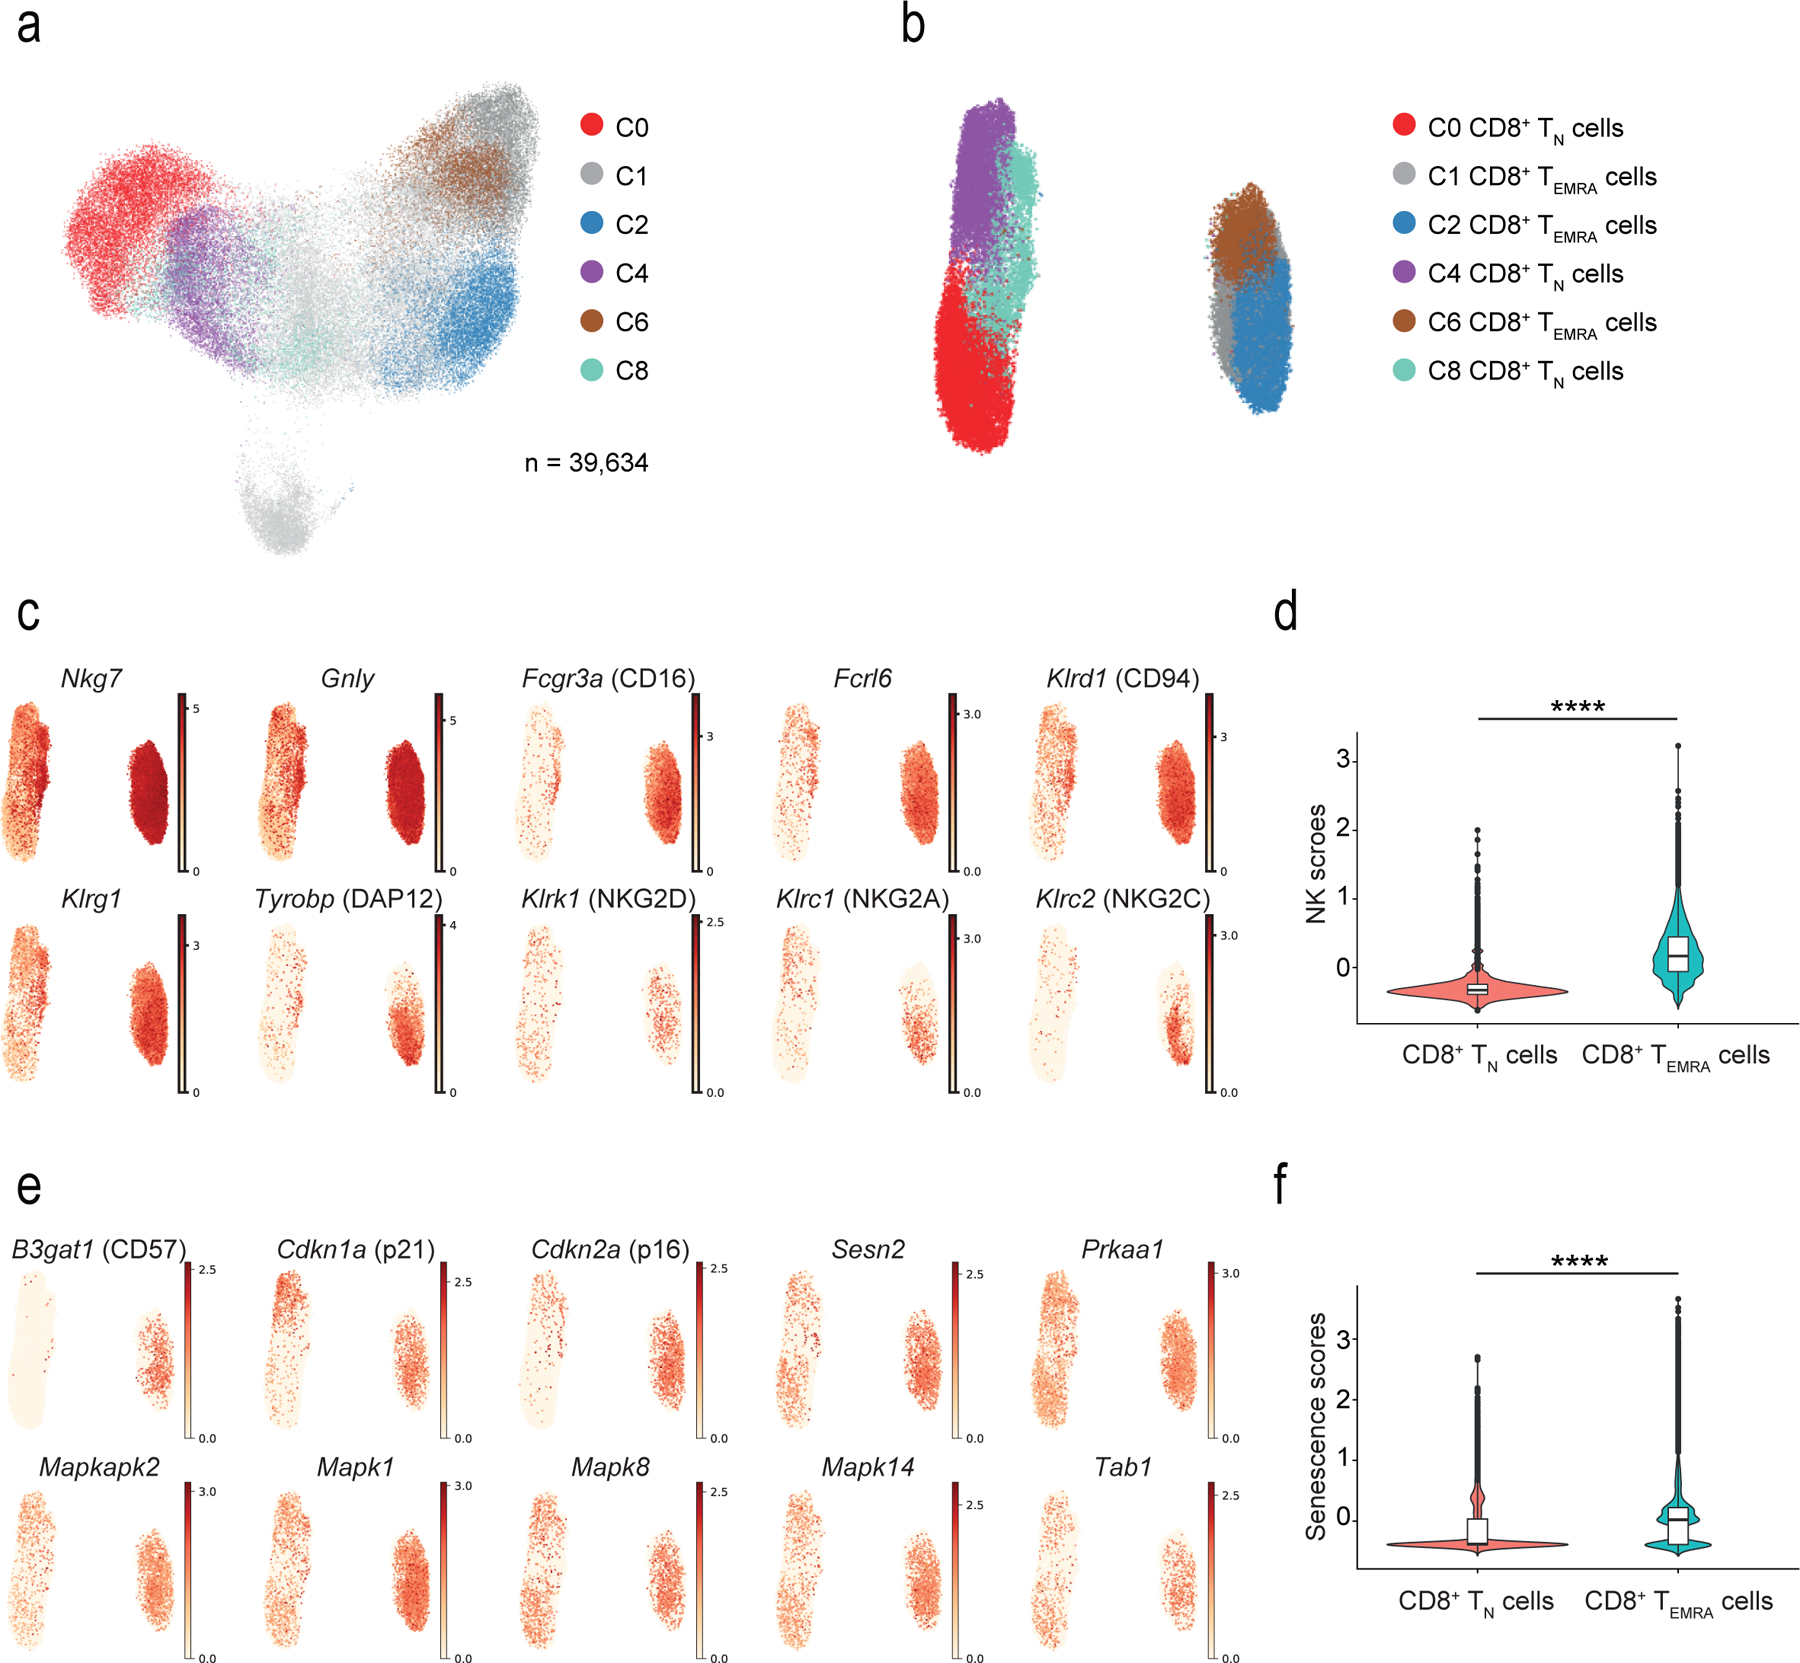
a) UMAP plot of single-cell sorted IL-7R+CD8+ and IL-7R−CD8+ T cells from six healthy older donors. Highlighted clusters were considered as TN (C0, C4 and C8) and TEMRA (C1, C2 and C6) compartments. b) UMAP plot showing re-clustering of selected TN (C0, C4, and C8) and TEMRA (C1, C2, and C6) CD8+ cells from a) (n = 39,634 cells). c) UMAP plots representing the expression values of NK-related genes in re-clustered TN and TEMRA CD8+ cells from b). Scales show low expression (yellow) to high expression (red). d) Violin plots of NK-related gene expression determined by scRNA-seq in TN and TEMRA CD8+ T cells clustered as in b) (means, range, and distribution of individual data; n = 39,364 single cells). e) UMAP plots showing expression of senescence-associated determined by scRNA-seq in TN and TEMRA CD8+ T cells re-clustered as in b). Scales show low expression (yellow) to high expression (red). Other aliases or CD numbers of some gene products are shown in brackets. f) Violin plots of senescence scores calculated based on the average normalized expression of each senescence-associated gene across TN and TEMRA CD8+ cells clustered as in b) (means, range, and distribution of individual data; n = 39,364 single cells). The gene lists used to define NK- and senescence-scores are given in Supplementary table 4).