
Fig. 5: Sestrins and Jnk MAPK dampen TCR signalling in CD27−CD28−CD8+ T cells.
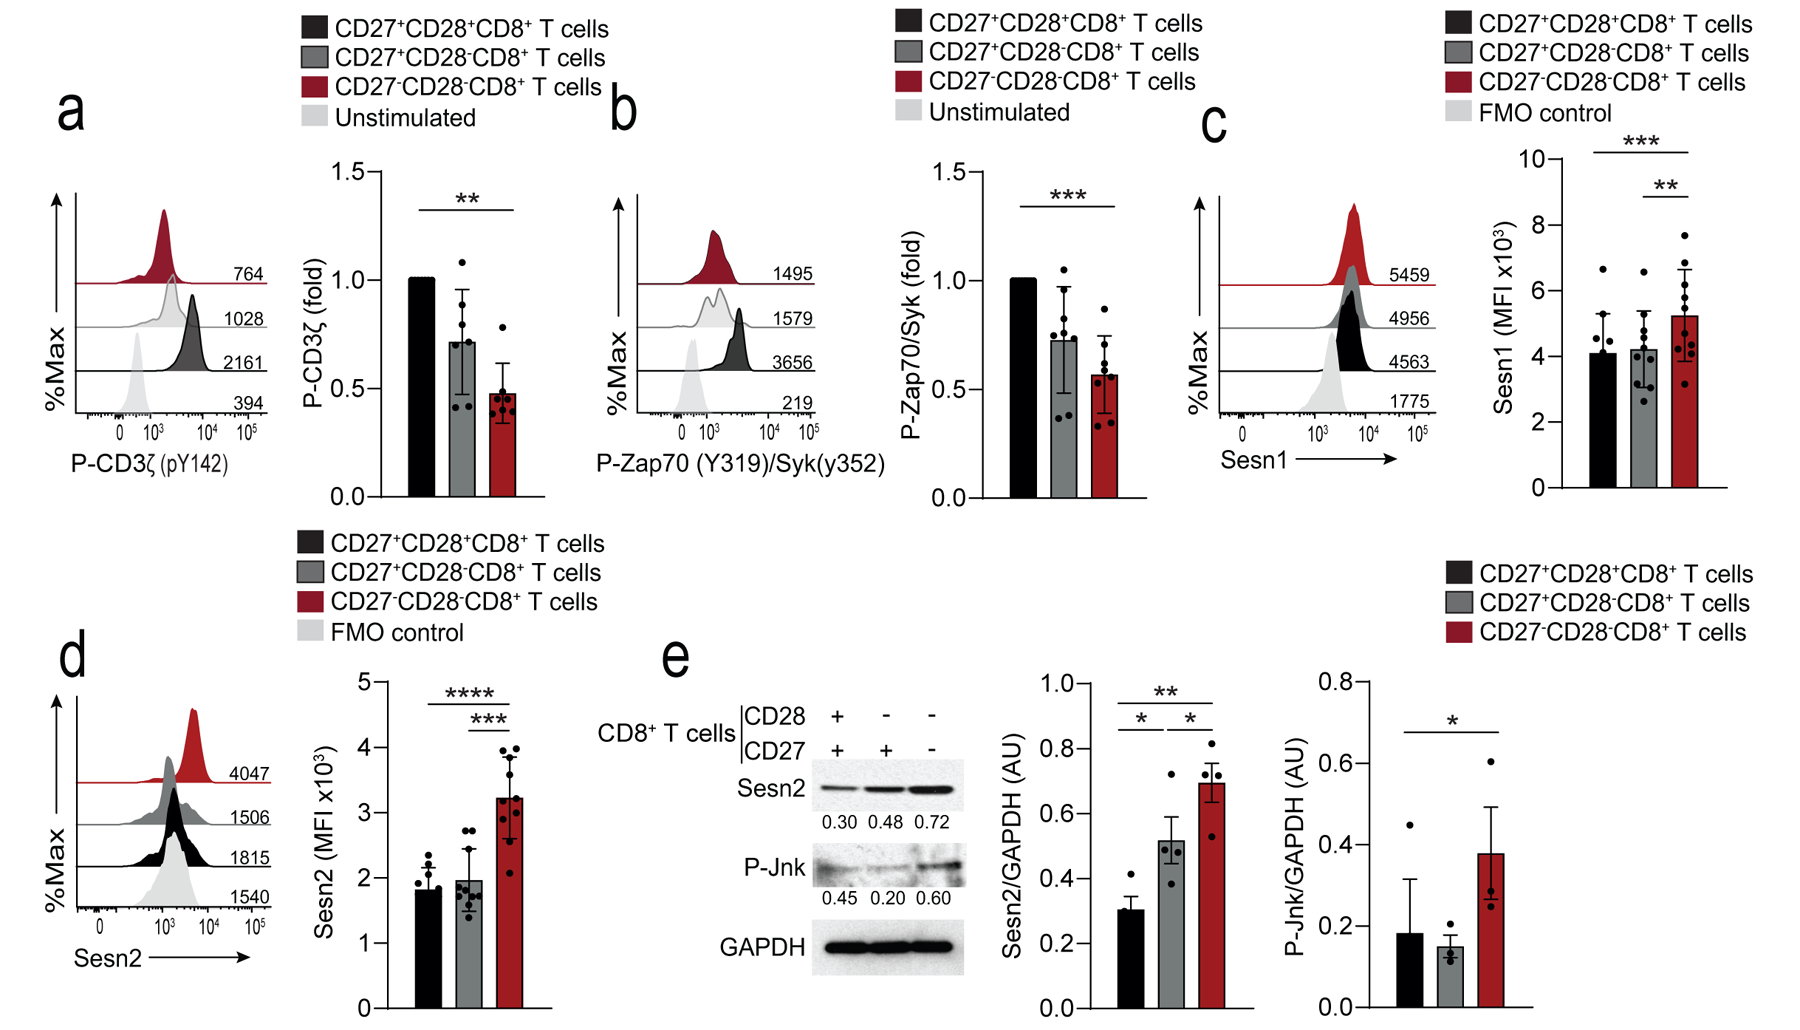
a) Representative histograms of P-CD3ζ in CD27+CD28+CD8+, CD27+CD28−CD8+, and CD27− CD28−CD8+ T cells stimulated with anti-CD3 (OKT3, 10 μg/mL, 15 minutes). Unstimulated CD27+CD28+CD8+ are shown as a control. Numbers on histograms represent the mean fluorescence intensity (MFI) for each subset. Summary data are given (means and s.d., n = 8 donors). b) Representative histograms of P-Zap70-Syk in CD27+CD28+CD8+, CD27+CD28− CD8+, and CD27−CD28−CD8+ T cells stimulated as in a). Unstimulated CD27+CD28+CD8+ are shown as a control. Numbers on histograms represent the mean fluorescence intensity (MFI) for each subset. Summary data are given (means and s.d., n = 8). Summary results presented as the MFI relative to that of DP CD8+ T cells, set to 1. c, d) Expression of Sesn1 c) and Sesn2 d) proteins determined by flow cytometry in CD27+CD28+CD8+, CD27+CD28−CD8+, and CD27−CD28−CD8+ T cells (means and s.d., n = 10 donors). e) Immunoblot of Sesn2 and p-Jnk (T183/Y185) in CD27+CD28+CD8+, CD27+CD28−CD8+, and CD27−CD28−CD8+ T cells, freshly isolated from peripheral blood of healthy donors. Representative of three independent experiments with similar results. Densitometry data from western blots for all donors is also shown (means and s.e.m., n = 3 donors for p-Jnk, n = 4 donors for Sesn2). Statistical significance determined with ANOVA with Friedman test and Dunn’s post-test correction in a-b), repeated measures one-way ANOVA with Tukey’s multiple comparisons test in c-e) (*p <0.05, **p <0.01, ***p <0.001, ****p <0.0001).