
Fig. 7: Sestrins induce an age-dependent NK phenotype in CD8+ T cells in vivo.
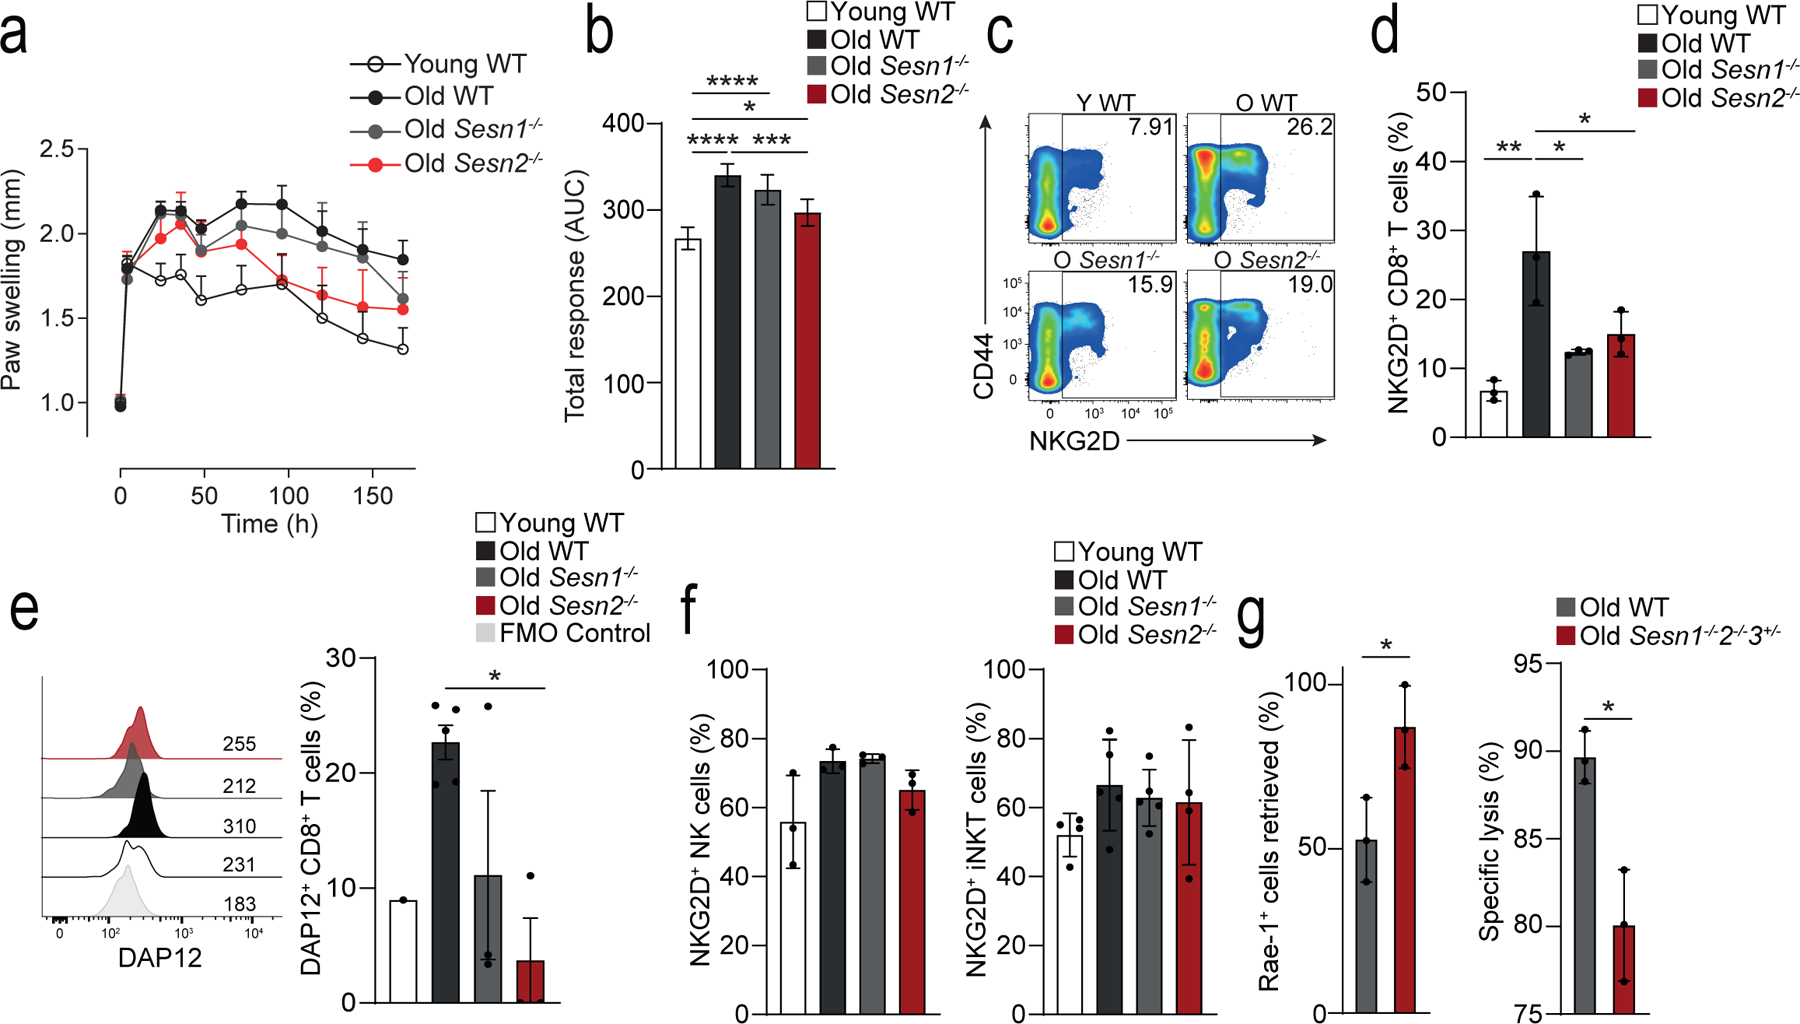
a) Measurement of paw size (normalized to the contralateral, PBS control paw) over time (0h, 4h, 24h, 36h, 2, 3, 4, 5, 6, 7 days) in young wild-type (young WT; n = 4), old WT (n = 10), old Sesn1−/− (n = 5) and old Sesn2−/− (n = 4) mice following intra-plantar treatment with mBSA. b) Area under the curve integration of the time course data shown in a) (means and s.d.) c) Representative pseudo-colour density plots showing CD44 vs NKG2D expression on TCRβ+CD3+CD8+ T cells isolated from spleens of young WT, old WT, old Sesn1−/−, and old Sesn2−/− mice. Frequencies of parent gates are shown in the top right-hand corner. d) Cumulative data of NKG2D expression in splenic TCRβ+CD3+CD8+ T cells from young WT, old WT, old Sesn1−/−, and old Sesn2−/− mice (n = 3 mice per group). e) Representative histogram of DAP12 expression from splenic TCRβ+CD3+CD8+ T cells from young WT, old WT, old Sesn1−/−, and old Sesn2−/− mice. FMO control is shown. Cumulative data shown (n = 3 per group, n = 1 young WT). f) NKG2D expression in splenic NK- and iNKT cells from the same mice as in c-d) (means and s.d., n = 3 mice per group). g) Retrieval of Rae-1+ 5TGM1 cells as a fraction of injected cells (left panel) and killing and specific lysis of injected Rae-1+ 5TGM1 cells (right panel) from the spleens of NK-depleted (24h, anti-NK1.1, i.p.) old WT and old Sesn1−/−Sesn2−/−Sesn3+/− mice 6 hours after i.v. challenge (means and s.d., n = 3 mice per group). Statistical significance determined with one-way ANOVA with Tukey’s multiple comparisons test in b,d-g); two-tailed unpaired Student’s t tests in h-i). (*p <0.05, **p <0.01, ***p <0.001, ****p <0.0001).