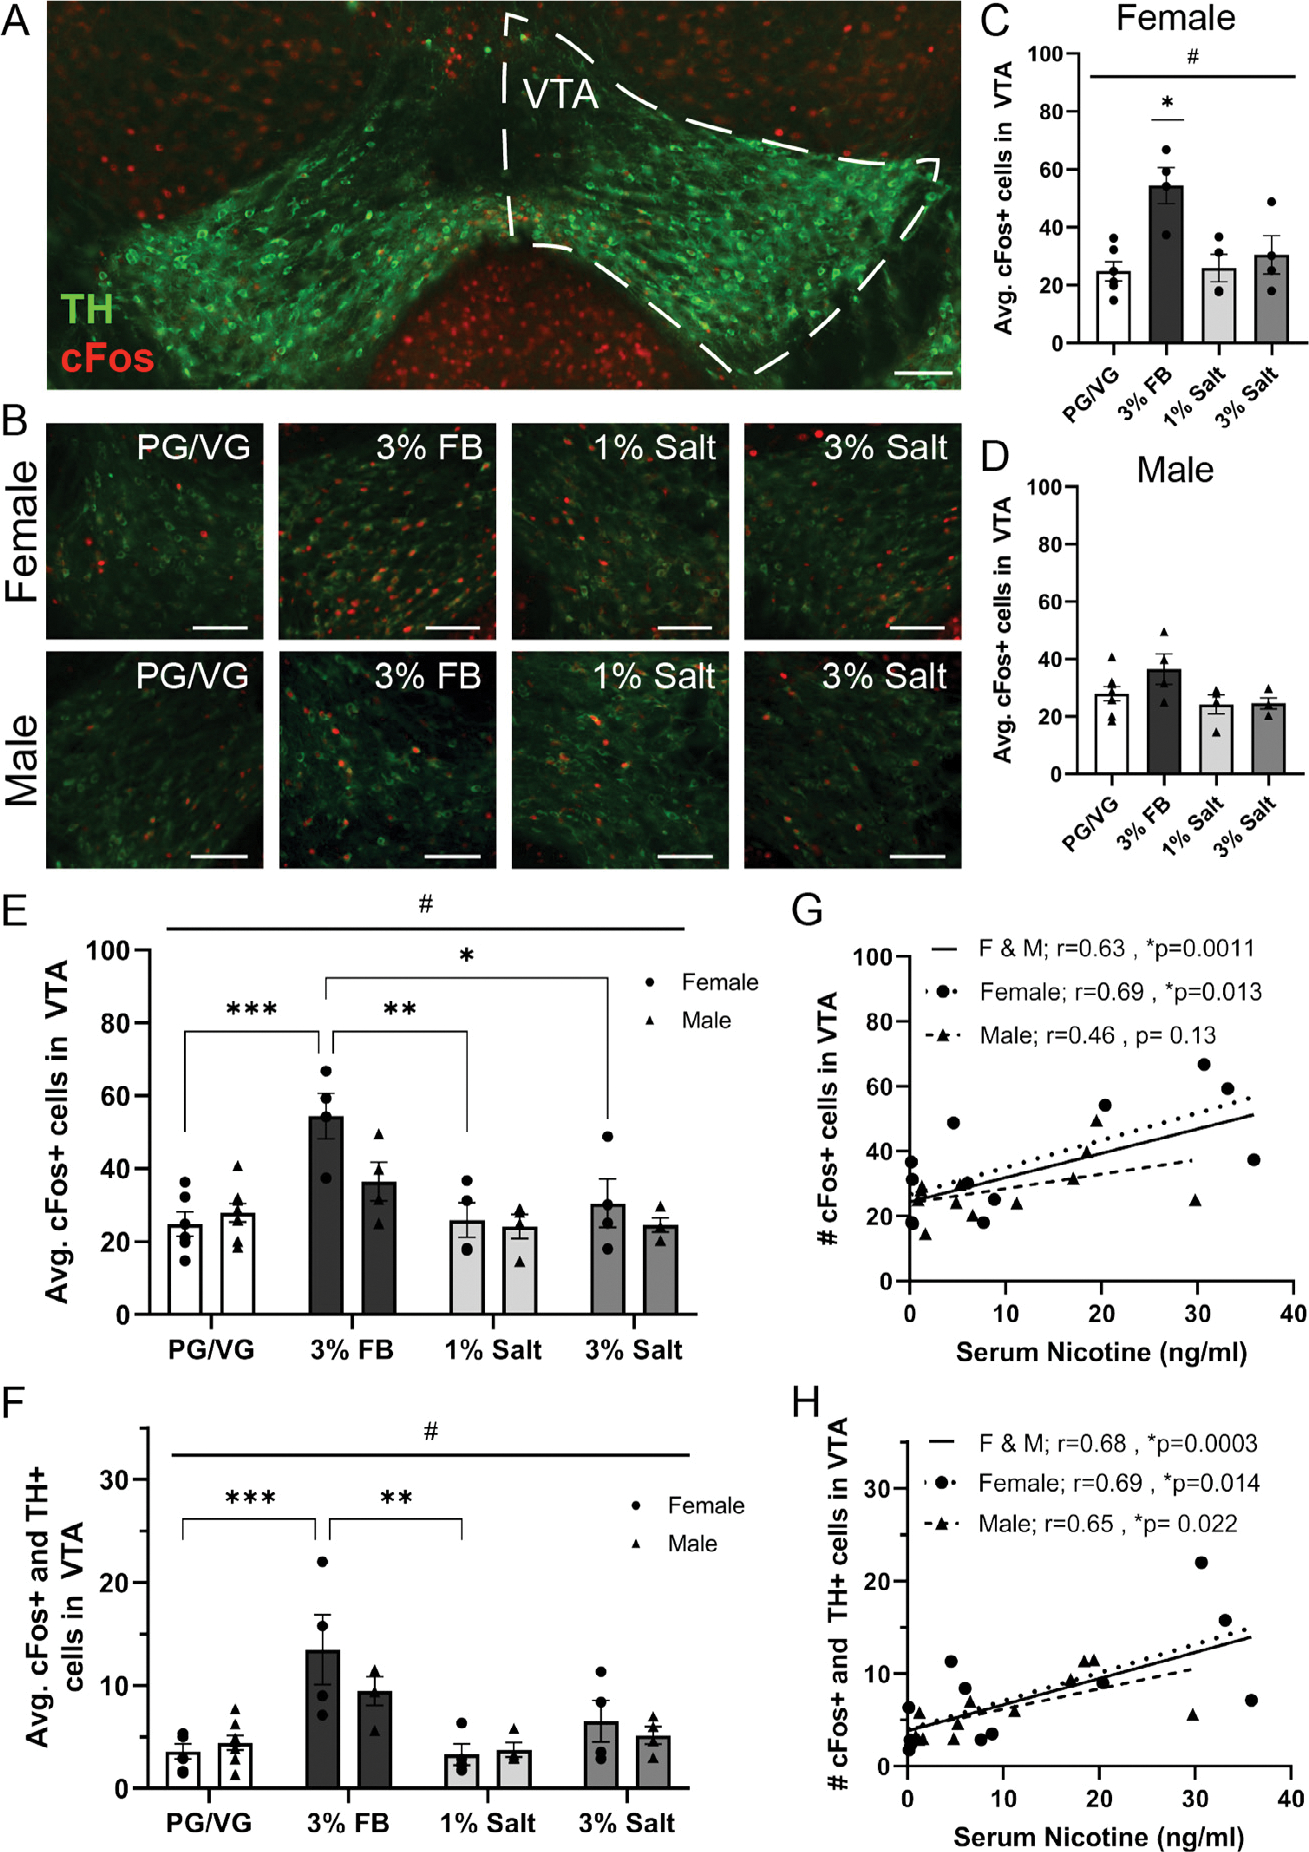
Fig. 3.

Neuronal activation in the ventral tegmental area following exposure to nicotine freebase vs. nicotine salt.
A) Representative image of the ventral tegmental area (right hemisphere outlined with dotted line) labeled with tyrosine hydroxylase (TH, green) and cFos (red). Scale bar = 100 μm.
B) Representative image of double labeling of tyrosine hydroxylase (TH, green) and cFos (red) expression in females (top row) and males (bottom row) exposed to PG/VG, 3% Nicotine Freebase (3% FB), 1% Nicotine Salt (1% Salt), or 3% Nicotine Salt (3% Salt) vapor. Scale bars = 100 μm.
C) Average cFos expression in females following exposure to different vapor content. #1-way ANOVA, p = 0.0037 * Post-hoc Tukey’s Female: 3% FB vs PG/VG, 3% FB vs 1% Salt, 3% FB vs 3% Salt.
D) Average cFos expression in males following exposure to different vapor content. 1-Way ANOVA, p = 0.1057.
E) Average cFos expression in females and males exposed to different vapor content. #Main effect of vapor content, p = 0.0001 * Post-hoc Tukey’s Female: 3% FB vs PG/VG, 3% FB vs 1% Salt, and 3% FB vs 3% Salt.
F) Average cFos and TH colocalization in females and males exposed to different vapor content. #Main effect of vapor content, p < 0.0001 * Post-hoc Tukey’s Female: 3% FB vs PG/VG and 3%FB vs 1% Salt.
G) Correlation of averaged cFos expression in females, males, and both sexes combined with serum nicotine levels.
H) Correlation of averaged cFos and TH colocalization in females, males, and both sexes combined with serum nicotine levels.
