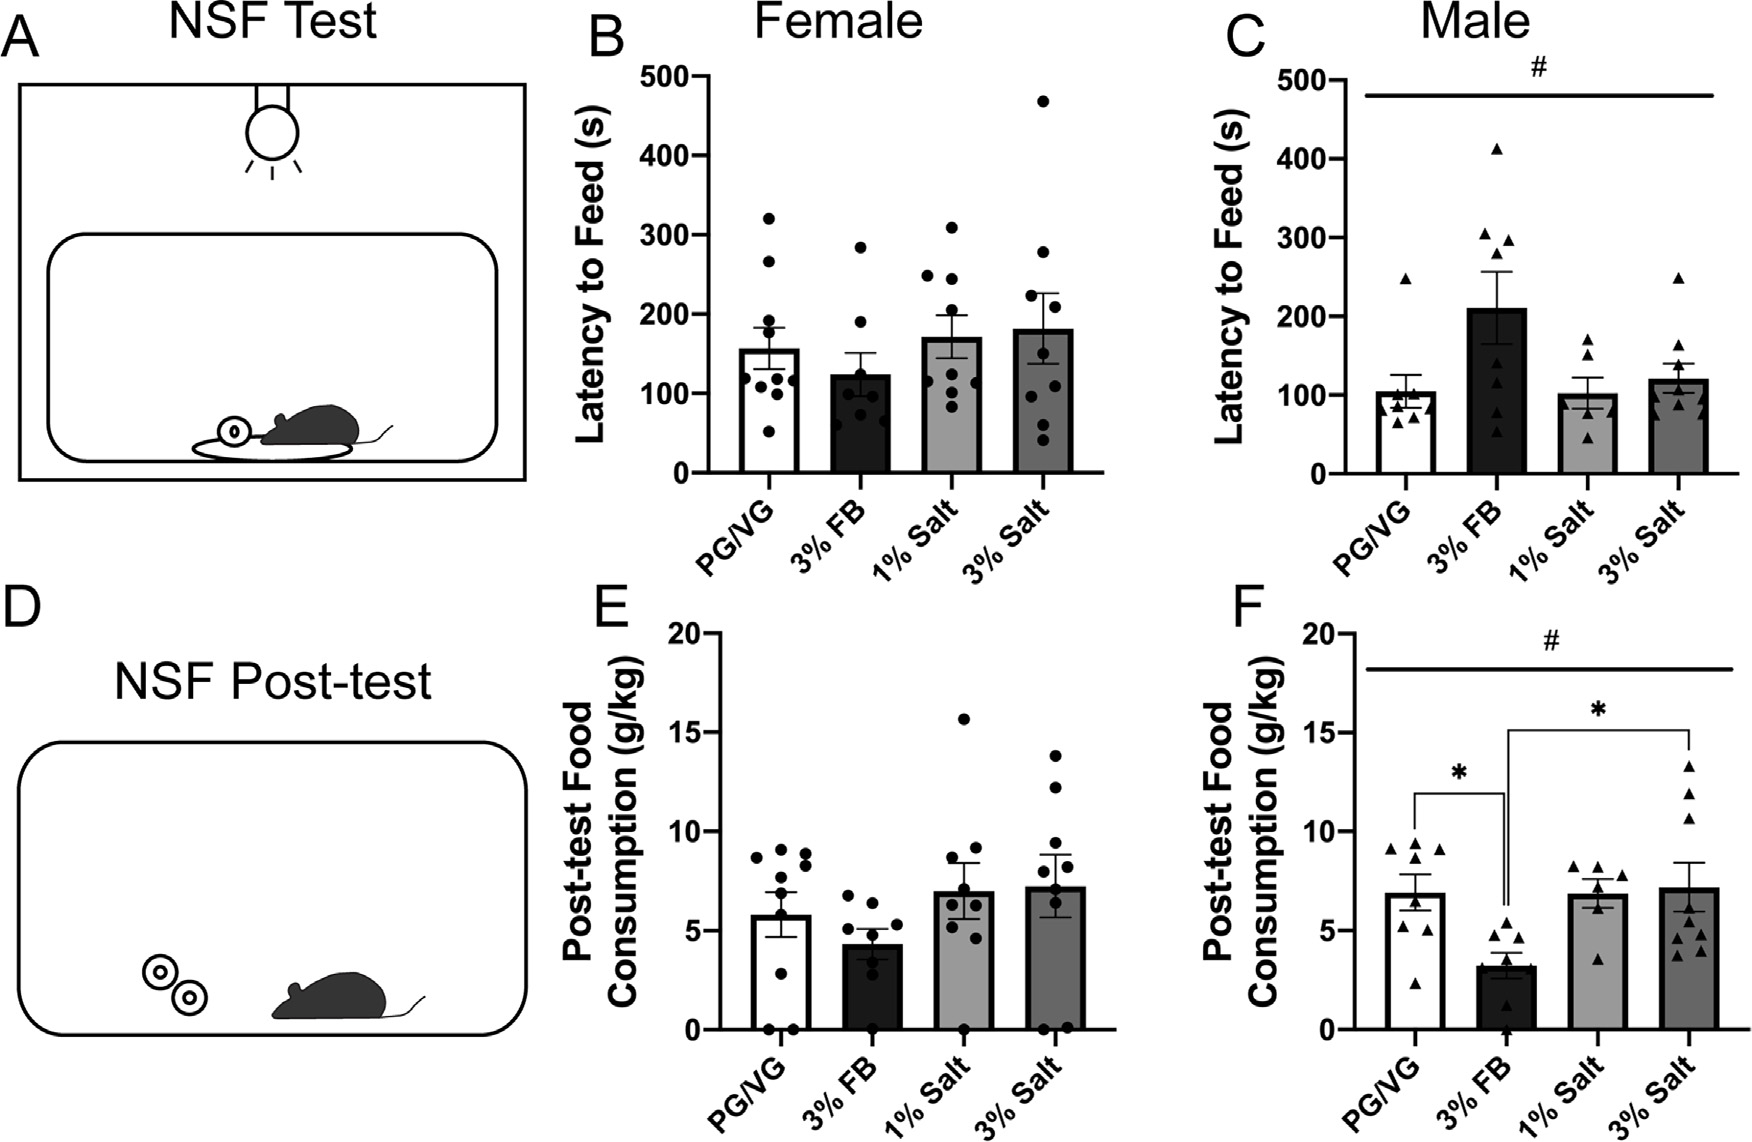
Fig. 4.

Anxiety-like and motivated behavior following exposure to nicotine freebase vs nicotine salt.
A) Diagram of the novelty-suppressed feeding (NSF) test.
B) Latency to feed time measured in females following exposure to PG/VG, 3% nicotine freebase (3% FB), 1% nicotine salt (1% salt), or 3% nicotine salt (3% salt) vapor. 1-way ANOVA, p = 0.6399.
C) Latency to feed time measured in males following exposure to PG/VG, 3% FB, 1% salt, or 3% salt vapor. #1-way ANOVA, p = 0.0453.
D) Diagram of the NSF post-test.
E) Post-test food consumption measured in females following exposure to PG/VG, 3% FB, 1% salt, or 3% salt vapor. 1-way ANOVA, p = 0.3928
F) Post-test food consumption measured in males following exposure to PG/VG, 3% FB, 1% salt, or 3% salt vapor. #1-way ANOVA, p = 0.0192 * Post-hoc Tukey’s: PG/VG vs. 3% FB and 3% FB vs. 3% salt.
