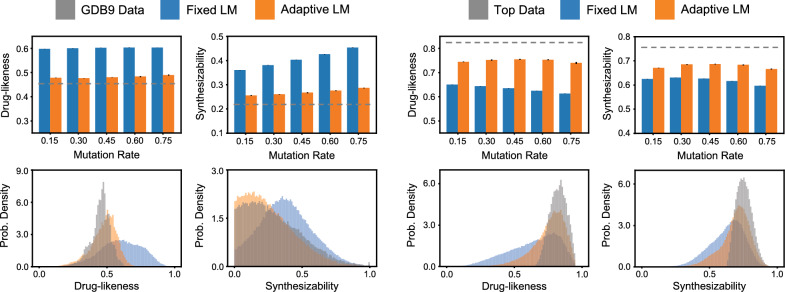
Fig. 2.
Distributions of molecules produced by a fixed and adaptive approach. Two datasets (GDB9 and a custom dataset with the top scoring molecules for drug-likeness and synthesizability) are used as training data. The fixed approach (blue) generates a broad distribution of molecule scores, while the adaptive approach (orange) more closely mimics the training dataset. Notice that for initial training data with low scores (i.e., GDB9), the adaptive approach produces lower scores on average than the fixed approach, while the situation is reversed for initial training data with high scores (i.e., Top)

