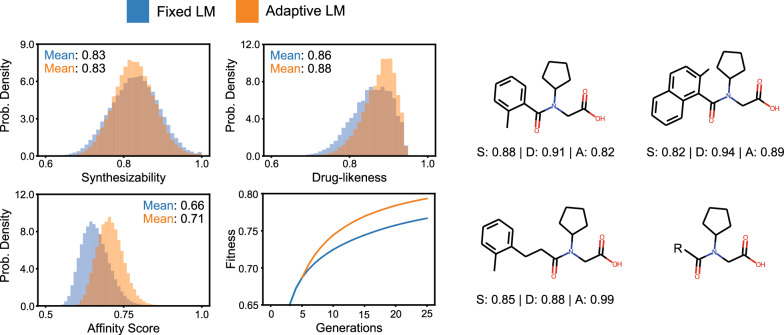
Fig. 5.
Fixed and adaptive approaches to optimize fitness given by the harmonic mean of synthesizability, drug-likeness, and affinity score. Changing to the adaptive approach after 5 generations results in an increase in fitness as shown by the histograms for drug-likeness and affinity score. The histograms were generated from the final population for the runs with the highest fitness for fixed and adaptive approaches. In the Fitness vs Generations subplots, Y-axis denotes average fitness of the population and plotted as mean over six runs. The related standard deviations are in the order of 0.1%0.2% of the mean values. Sample molecules with similar chemical structures are shown for the adaptive approach. Mutations proposed by the language model show how modifications result in changes in the metrics used to calculate fitness

