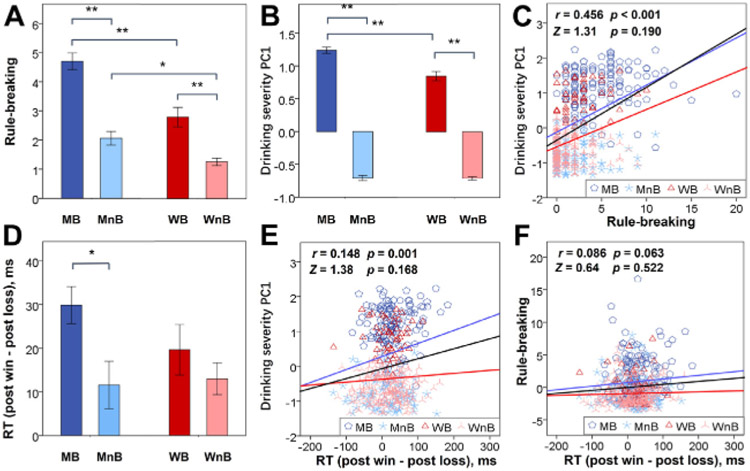
Figure 1.
Clinical and behavioral measures of male binger (MB), male nonbinger (MnB), female binger (WB), and female nonbinger (WnB) subjects. (A) Rule-breaking score. (B) Severity of alcohol use as quantified by the weight of the first principal component (PC1) of a principal component analysis of all 15 drinking measures. (C) Correlation of drinking severity PC1 with rule-breaking score across all subjects (regression line in black) and men (blue line) and women (red line) separately. (D) Difference in post-win and post-loss reaction time (RT). All histograms show mean ± SE; **p ≤ .001 and *p ≤ .05 show the statistics of simple effects analyses. Correlation of (E) drinking severity PC1 and of (F) rule-breaking score with RT (post-win minus post-loss) are shown for all subjects (black line), men (blue line), and women (red line). Data points are represented by different symbols for MB, MnB, WB, and WnB. The r and p values reflect the correlation for all subjects, and the Z and p values reflect the slope tests of sex differences in the regression. We did not show the r and p values separately for men and women because the regressions did not show significant sex differences in the slope. Note that the residuals are plotted here with age accounted for in the regressions.

