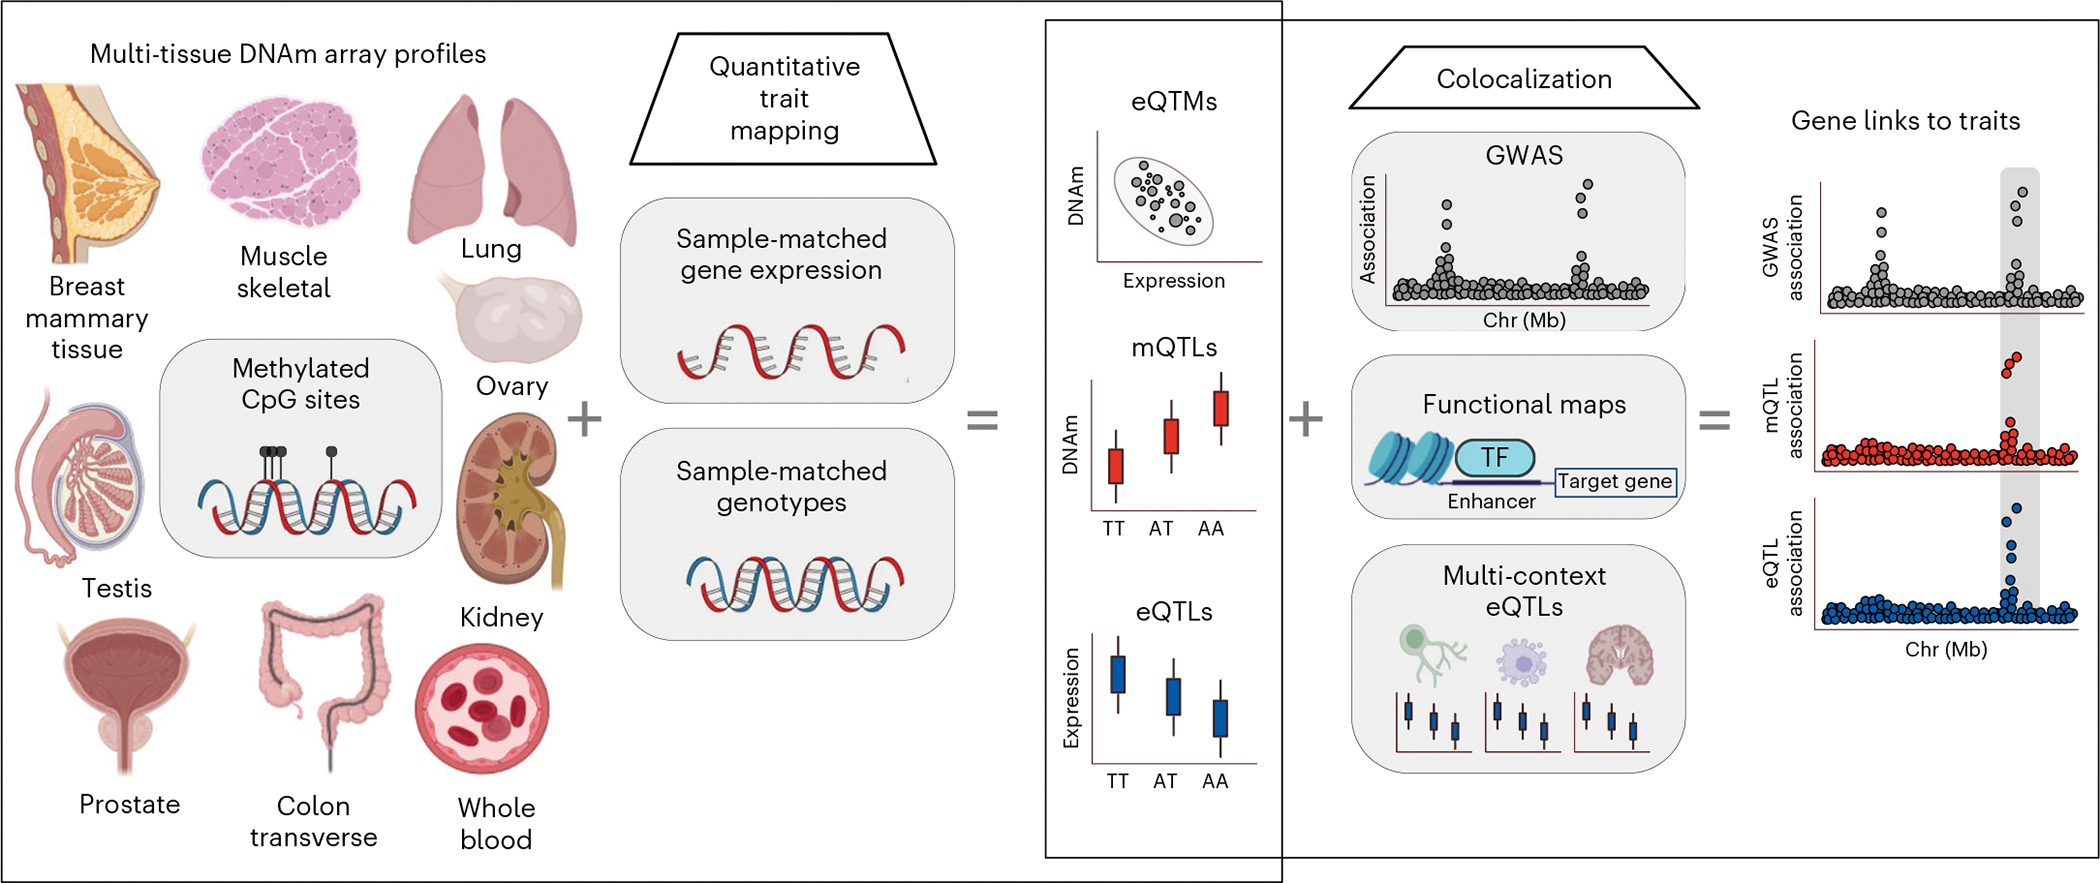
Fig. 1 |. Scheme of data generation and analysis overview.

Multi-tissue DNAm Illumina EPIC-array-based profiles are integrated with GTEx project sample-matched gene expression to map DNAm-expression correlations (eQTMs). Sample-matched genotype data are integrated to map mQTLs and eQTLs. e/mQTL signal is colocalized with GWAS data and multi-context eQTLs, and integrated with eQTMs and functional maps, to link variants and genes to traits. This figure was created with adapted templates from http://biorender.com.
