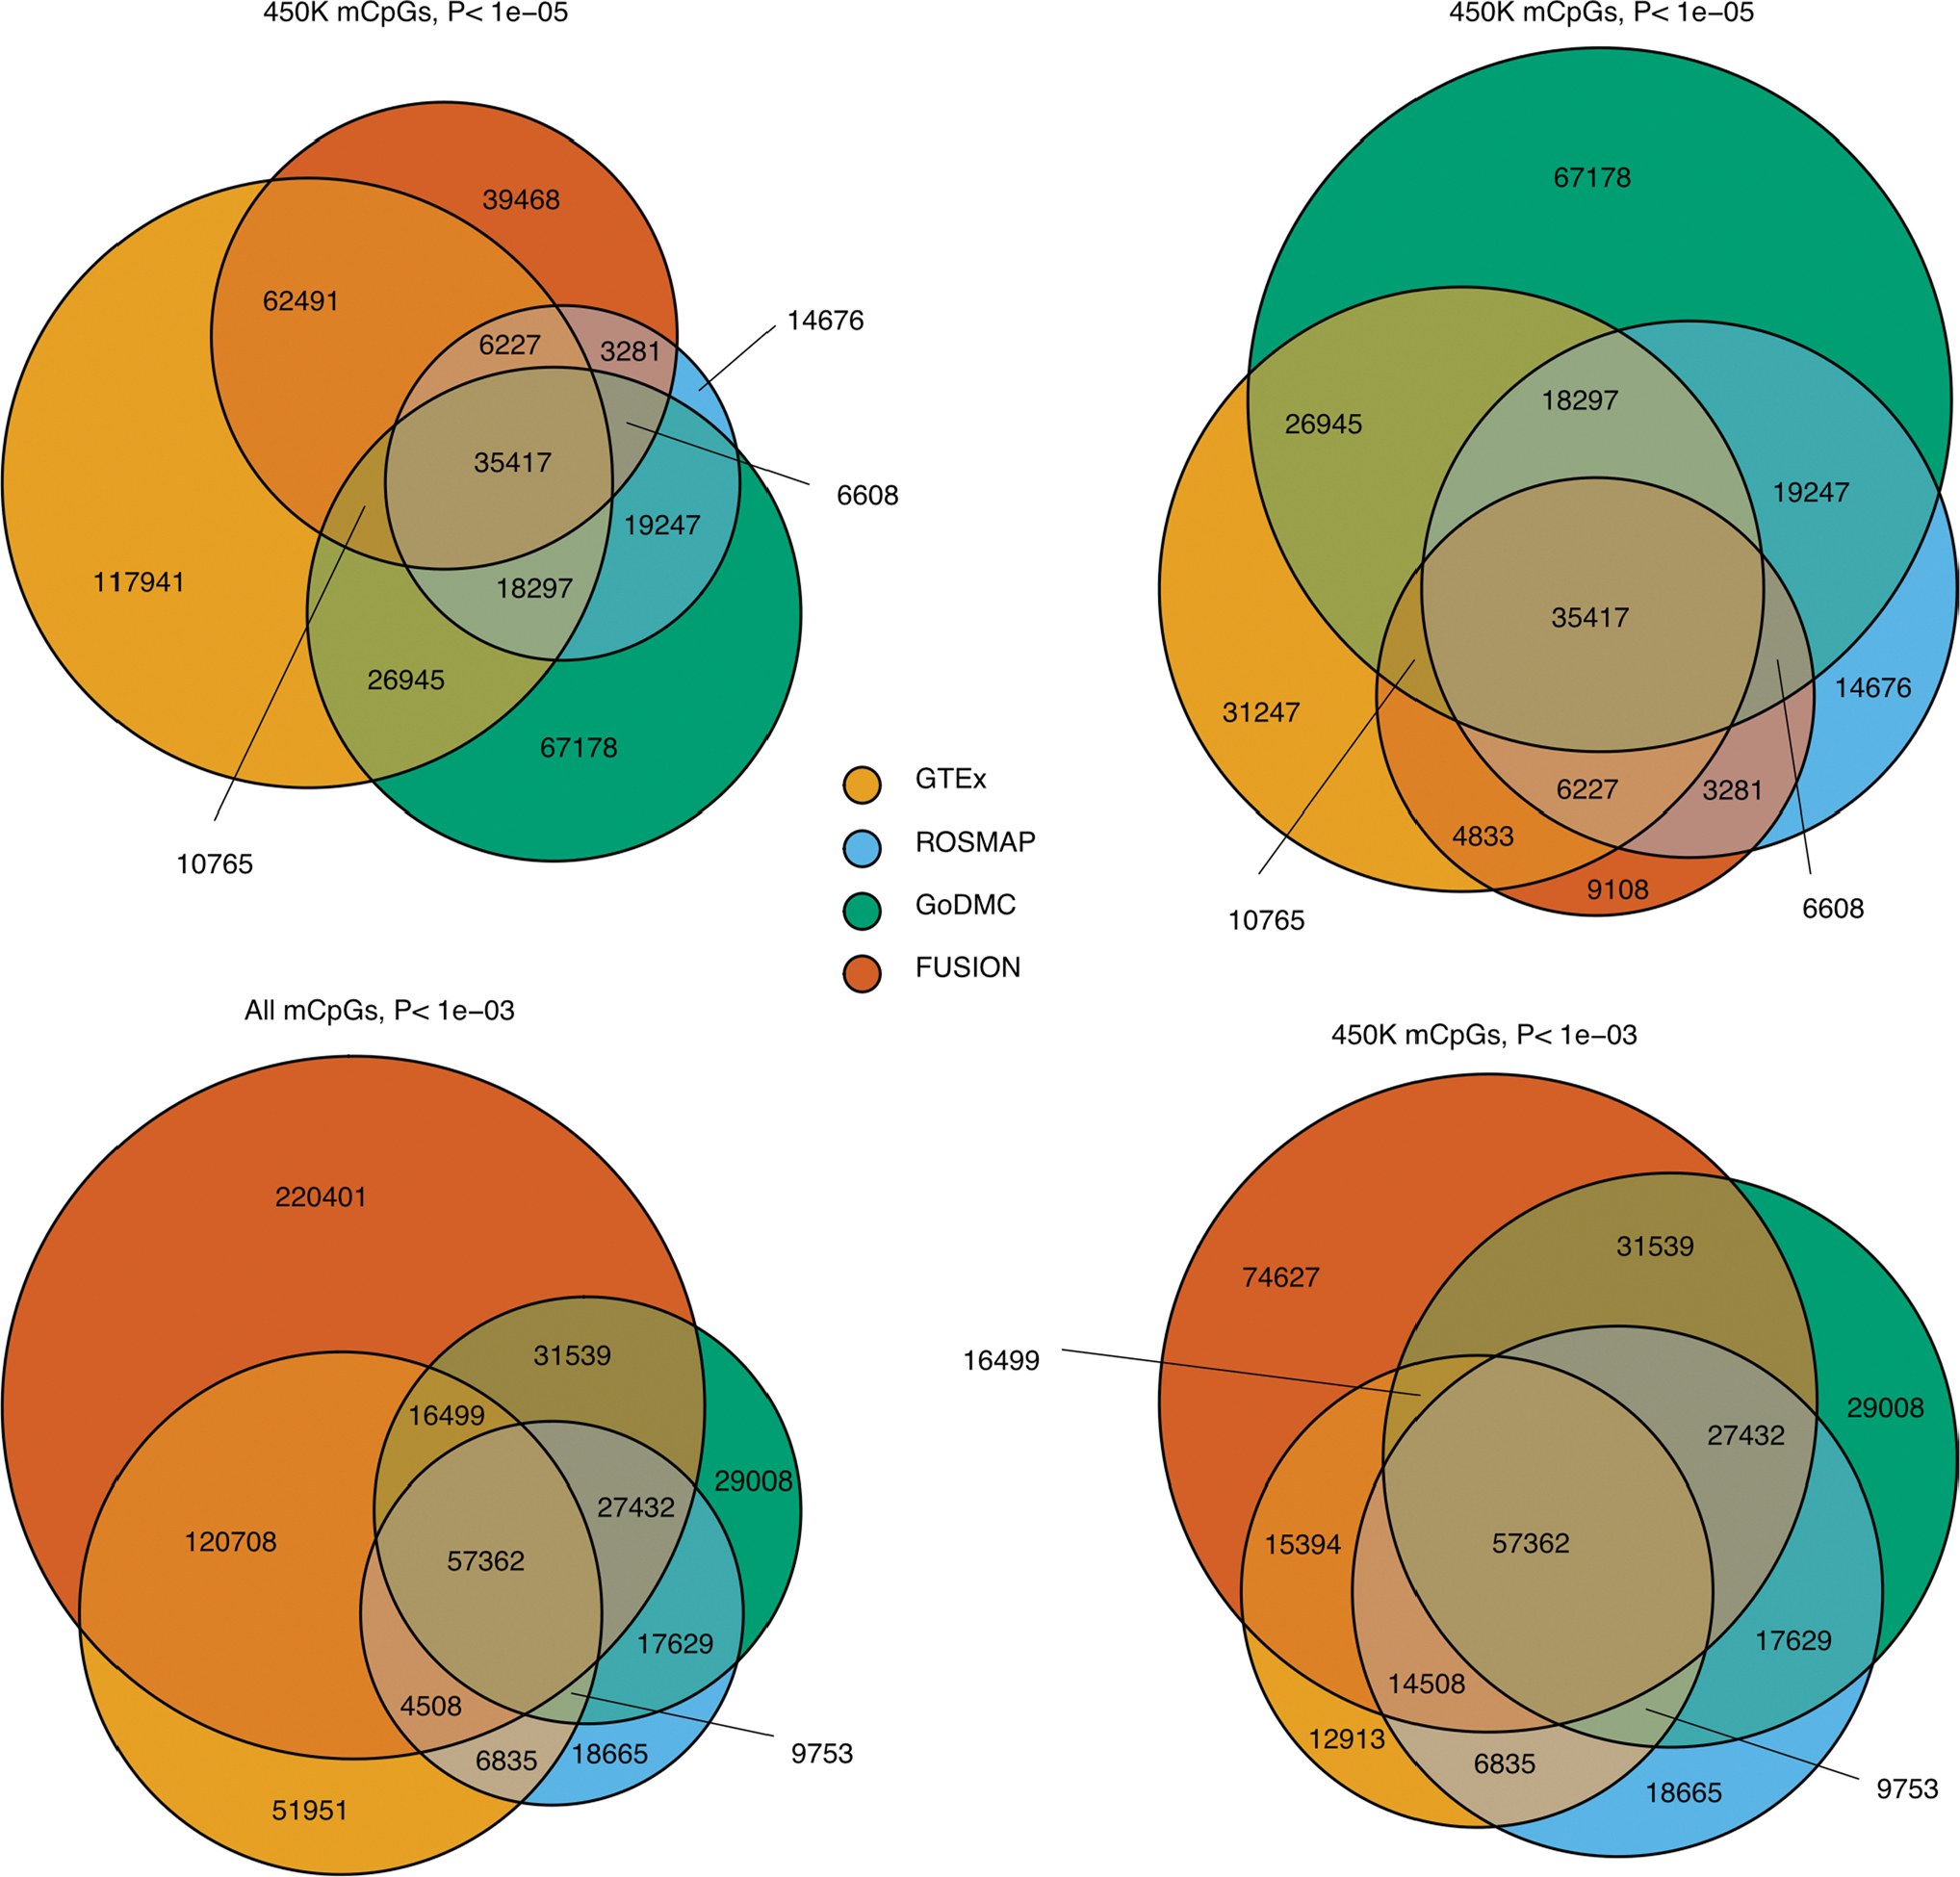
Extended Data Fig. 5 |. Representativity of GTEx mCpGs in external cohorts.

Overlap of mCpGs identified in GTEx (FDR < 0.05) with mCpGs identified in external mQTL cohorts at different nominal p-value thresholds (P < 1e-03 and P < 1e-05). Results are represented for all mCpGs - detected in EPIC and/or 450 K Illumina array - and for 450 K Illumina array CpG sites exclusively. P-value thresholds correspond to external cohort nominal mQTL associations, derived from QTL mapping by multiple regression two-sided t-tests.
