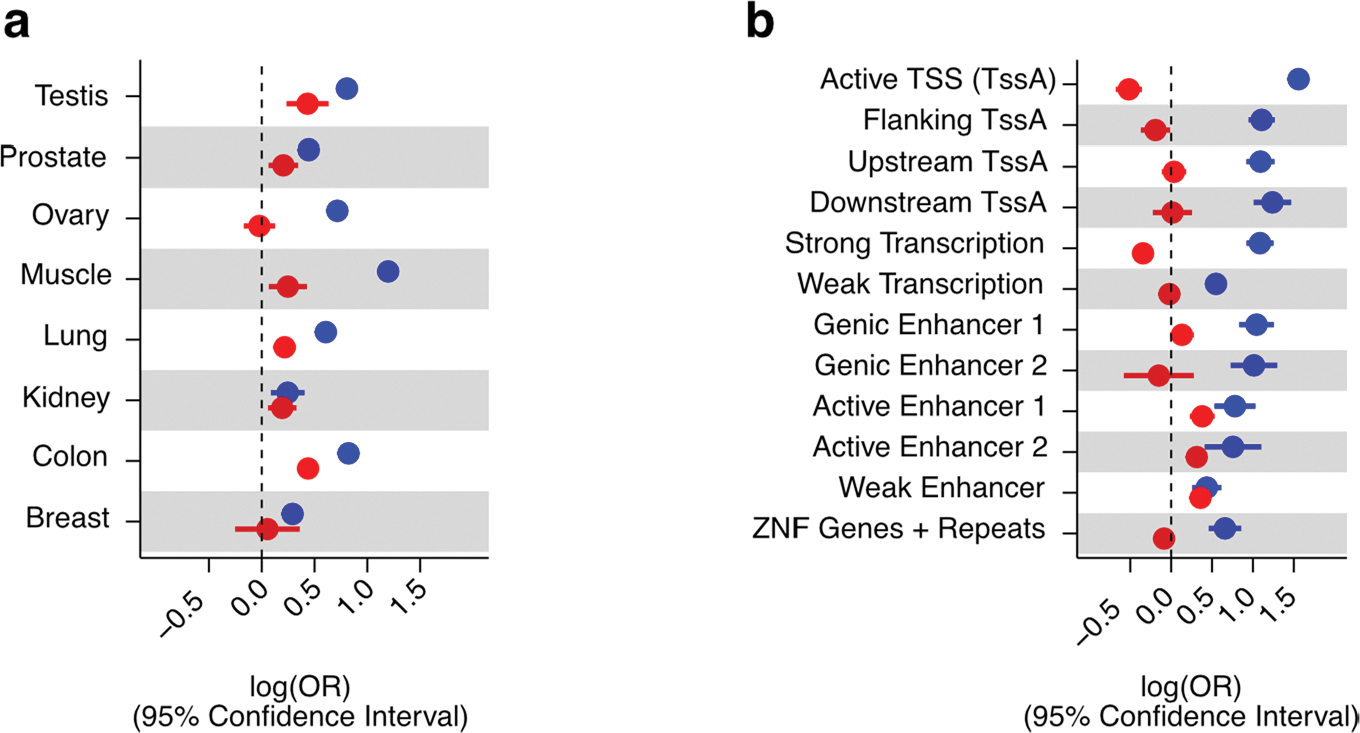
Extended Data Fig. 6 |. Enrichment of QTLs in chromatin states.

(a) QTL enrichment (x-axis) in tissue-matching open chromatin regions derived from ENCODE DNase-seq profiles per tissue (y-axis). Whole blood is excluded due to lack of a tissue-matching DNase-seq profile. Enrichment differences between tissues may be due in part to per-tissue DNase-seq data quality. (b) QTL enrichment (x-axis) in active chromatin states. OR: Odds Ratio. Enrichment values correspond to maximum-likelihood estimated log(ORs) for single-tissue in (a) and from across-tissue (nine tissues) meta-analysis in (b). In all panels, whiskers represent the 95% confidence interval of the enrichment value.
