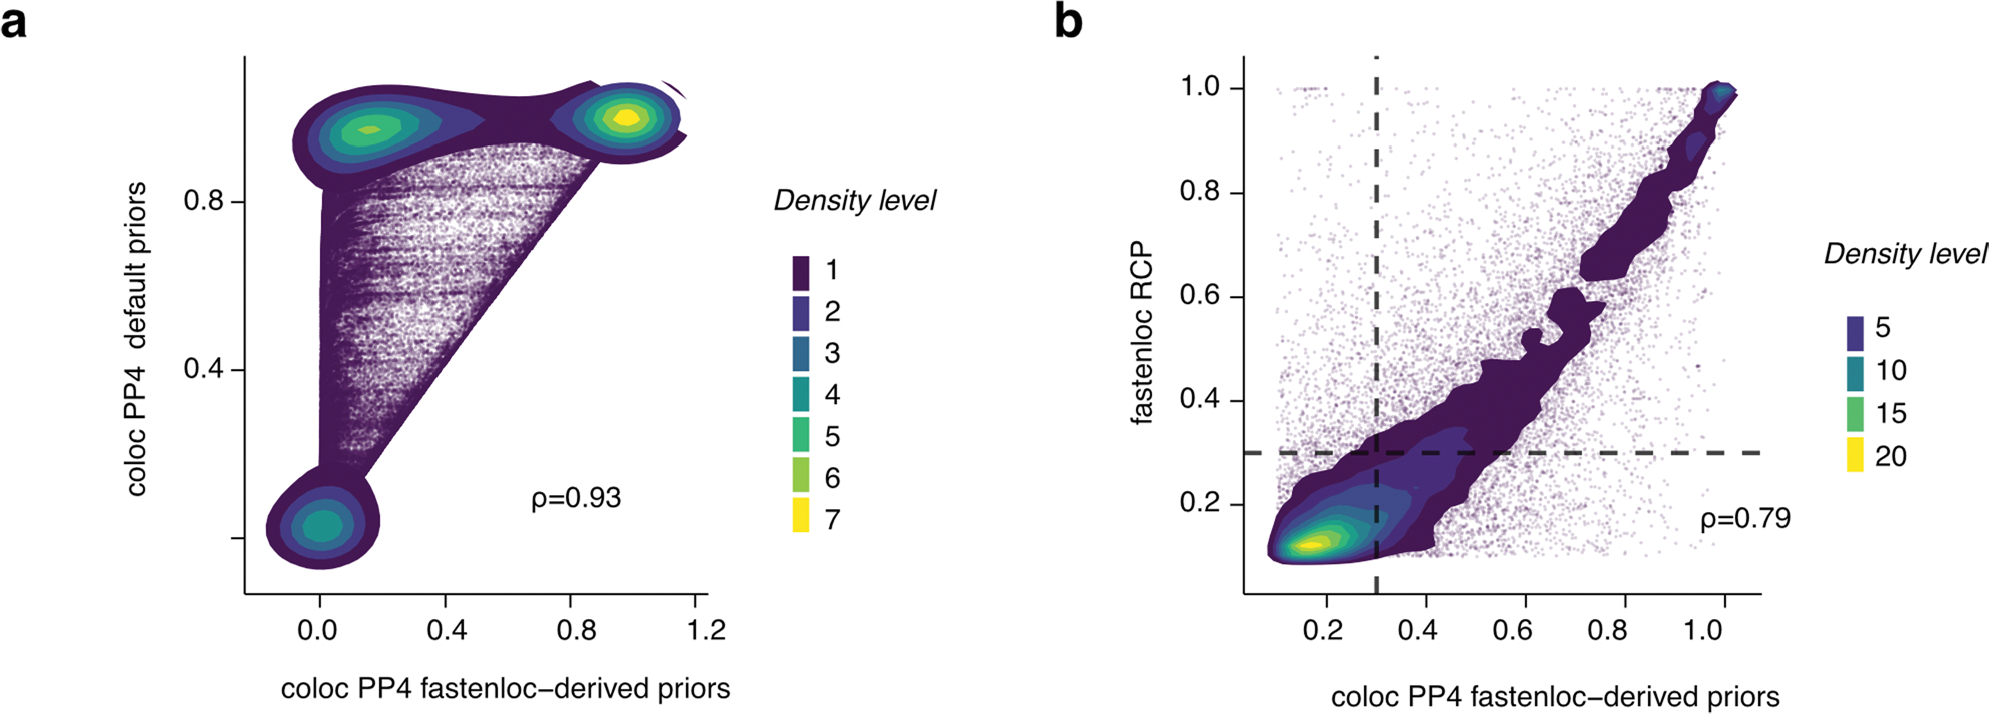
Extended Data Fig. 8 |. Evaluation of mQTL-GWAS colocalization approach.

(a) Density plot of mQTL-GWAS colocalization scores based on coloc run with default (y axis) and fastenloc-derived priors (x axis) on UKB standing height GWAS; Spearman’s rho is shown. Each dot corresponds to a colocalization test for a particular GWAS hit, independent mQTL and tissue combination. (b) Density plot of mQTL-GWAS colocalization scores based on coloc (x axis) and fastenloc (y axis) approaches on all GWASs; Spearman’s rho is shown. Each dot corresponds to a colocalization test for a particular GWAS, GWAS hit, independent mQTL and tissue combination. Dots within the top-right quadrant correspond to significant (RCP > 0.3 and PP4 > 0.3) colocalizations. PP4: coloc-derived posterior probability where the two traits share a single causal variant. RCP: fastenloc-derived probability of a genomic region harboring a colocalized signal.
