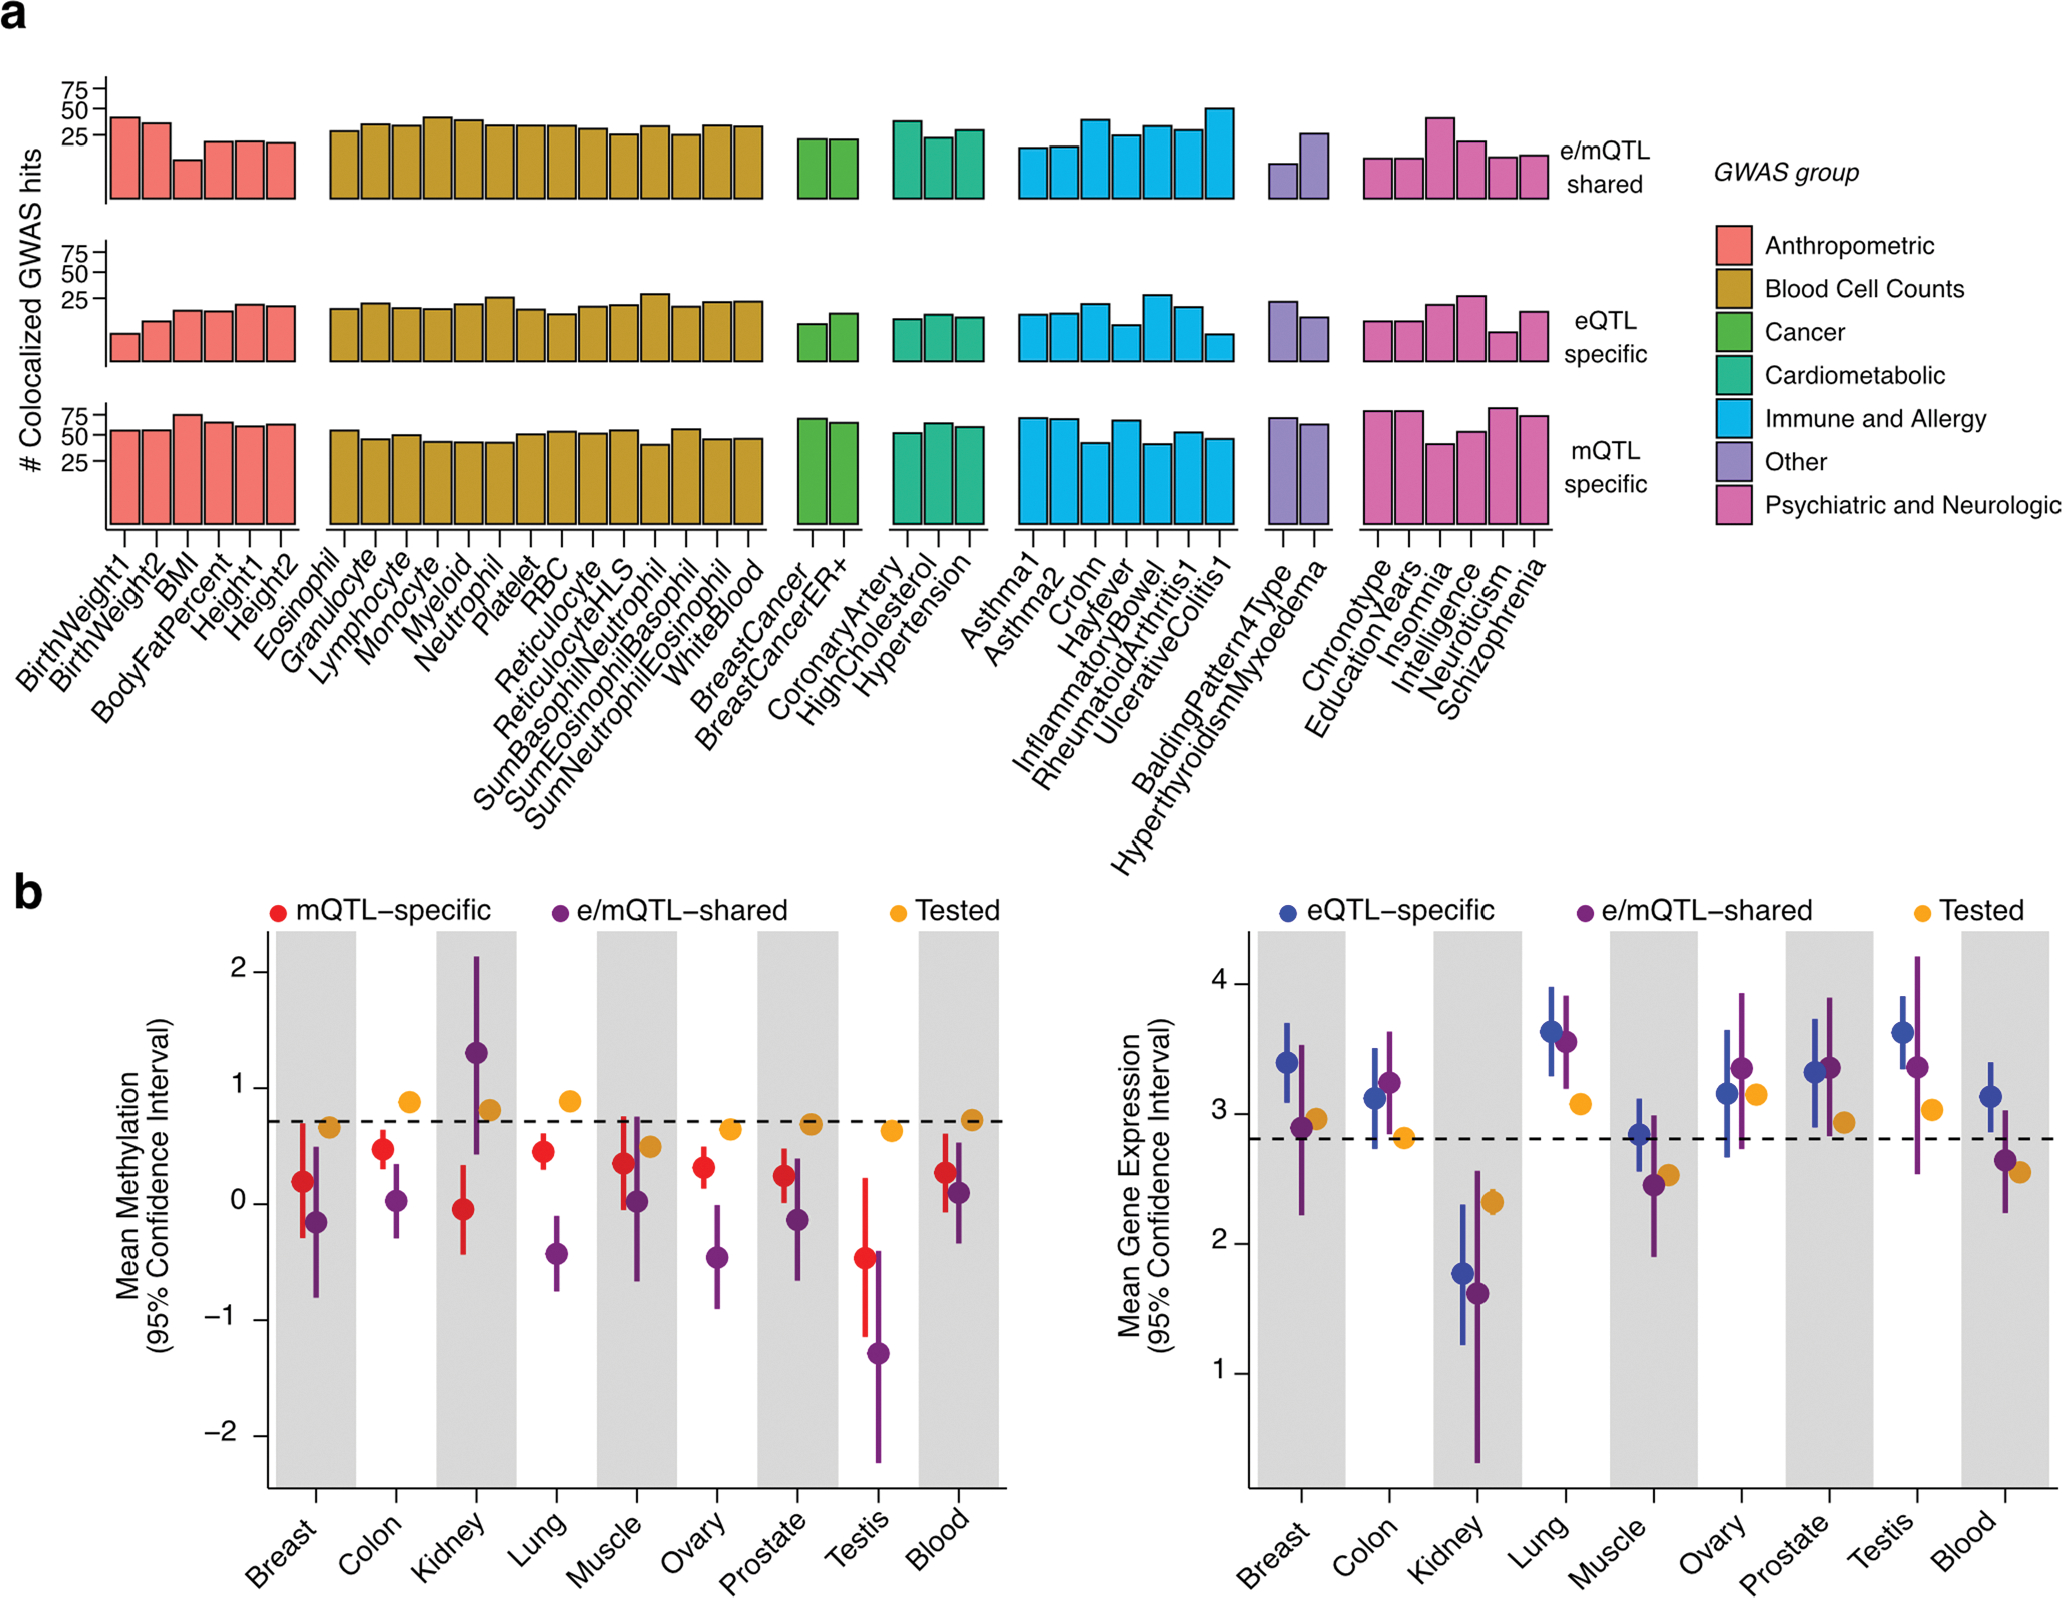
Extended Data Fig. 9 |. Signatures of QTL-GWAS colocalizations and trait-linked QTLs.

(a) Percent of QTL-colocalized GWAS hits (y axis) per GWAS trait (x axis) stratified by GWAS trait category and colocalization group (see Fig. 4). Only GWAS traits with > = 10 colocalized GWAS hits are displayed. (b) Mean DNAm - in M-values - of mCpGs (left panel) and gene expression - in log2(TPM + 1) - of eGenes (right panel) tested for colocalization, stratified by tissue and colocalization group (see Fig. 4). Mean DNAm and gene expression across tissues is indicated by a dashed line. Whiskers represent the 95% confidence interval of the mean, calculated based on 5,000 replications of bootstrapped samples (random sampling with replacement). The number of mCpGs/eGenes (N) tested per bootstrap is as follows: NMeanMethylation = (12472|51|124), (147806|306|1111), (17574|24|221), (157356|359|1234), (13623|45|162), (127008|147|1041), (65147|103|60), (13576|38|101), (20127|126|254) and NMeanGeneExpression = (10050|27|168), (10800|110|103), (1147|4|22), (13053|144|149), (12594|33|218), (5120|55|47), (6744|43|75), (17025|18|164), (11545|95|291) for QTL-GWAS tested, e/mQTL-shared and e/mQTL-specific eGenes/mCpGs in Breast|Col on|Kidney|Lung|Muscle|Ovary|Prostate|Testis|Blood tissues, respectively.
