
Fig. 2 |. mQTL discovery and e/mQTL functional mechanism characterization.
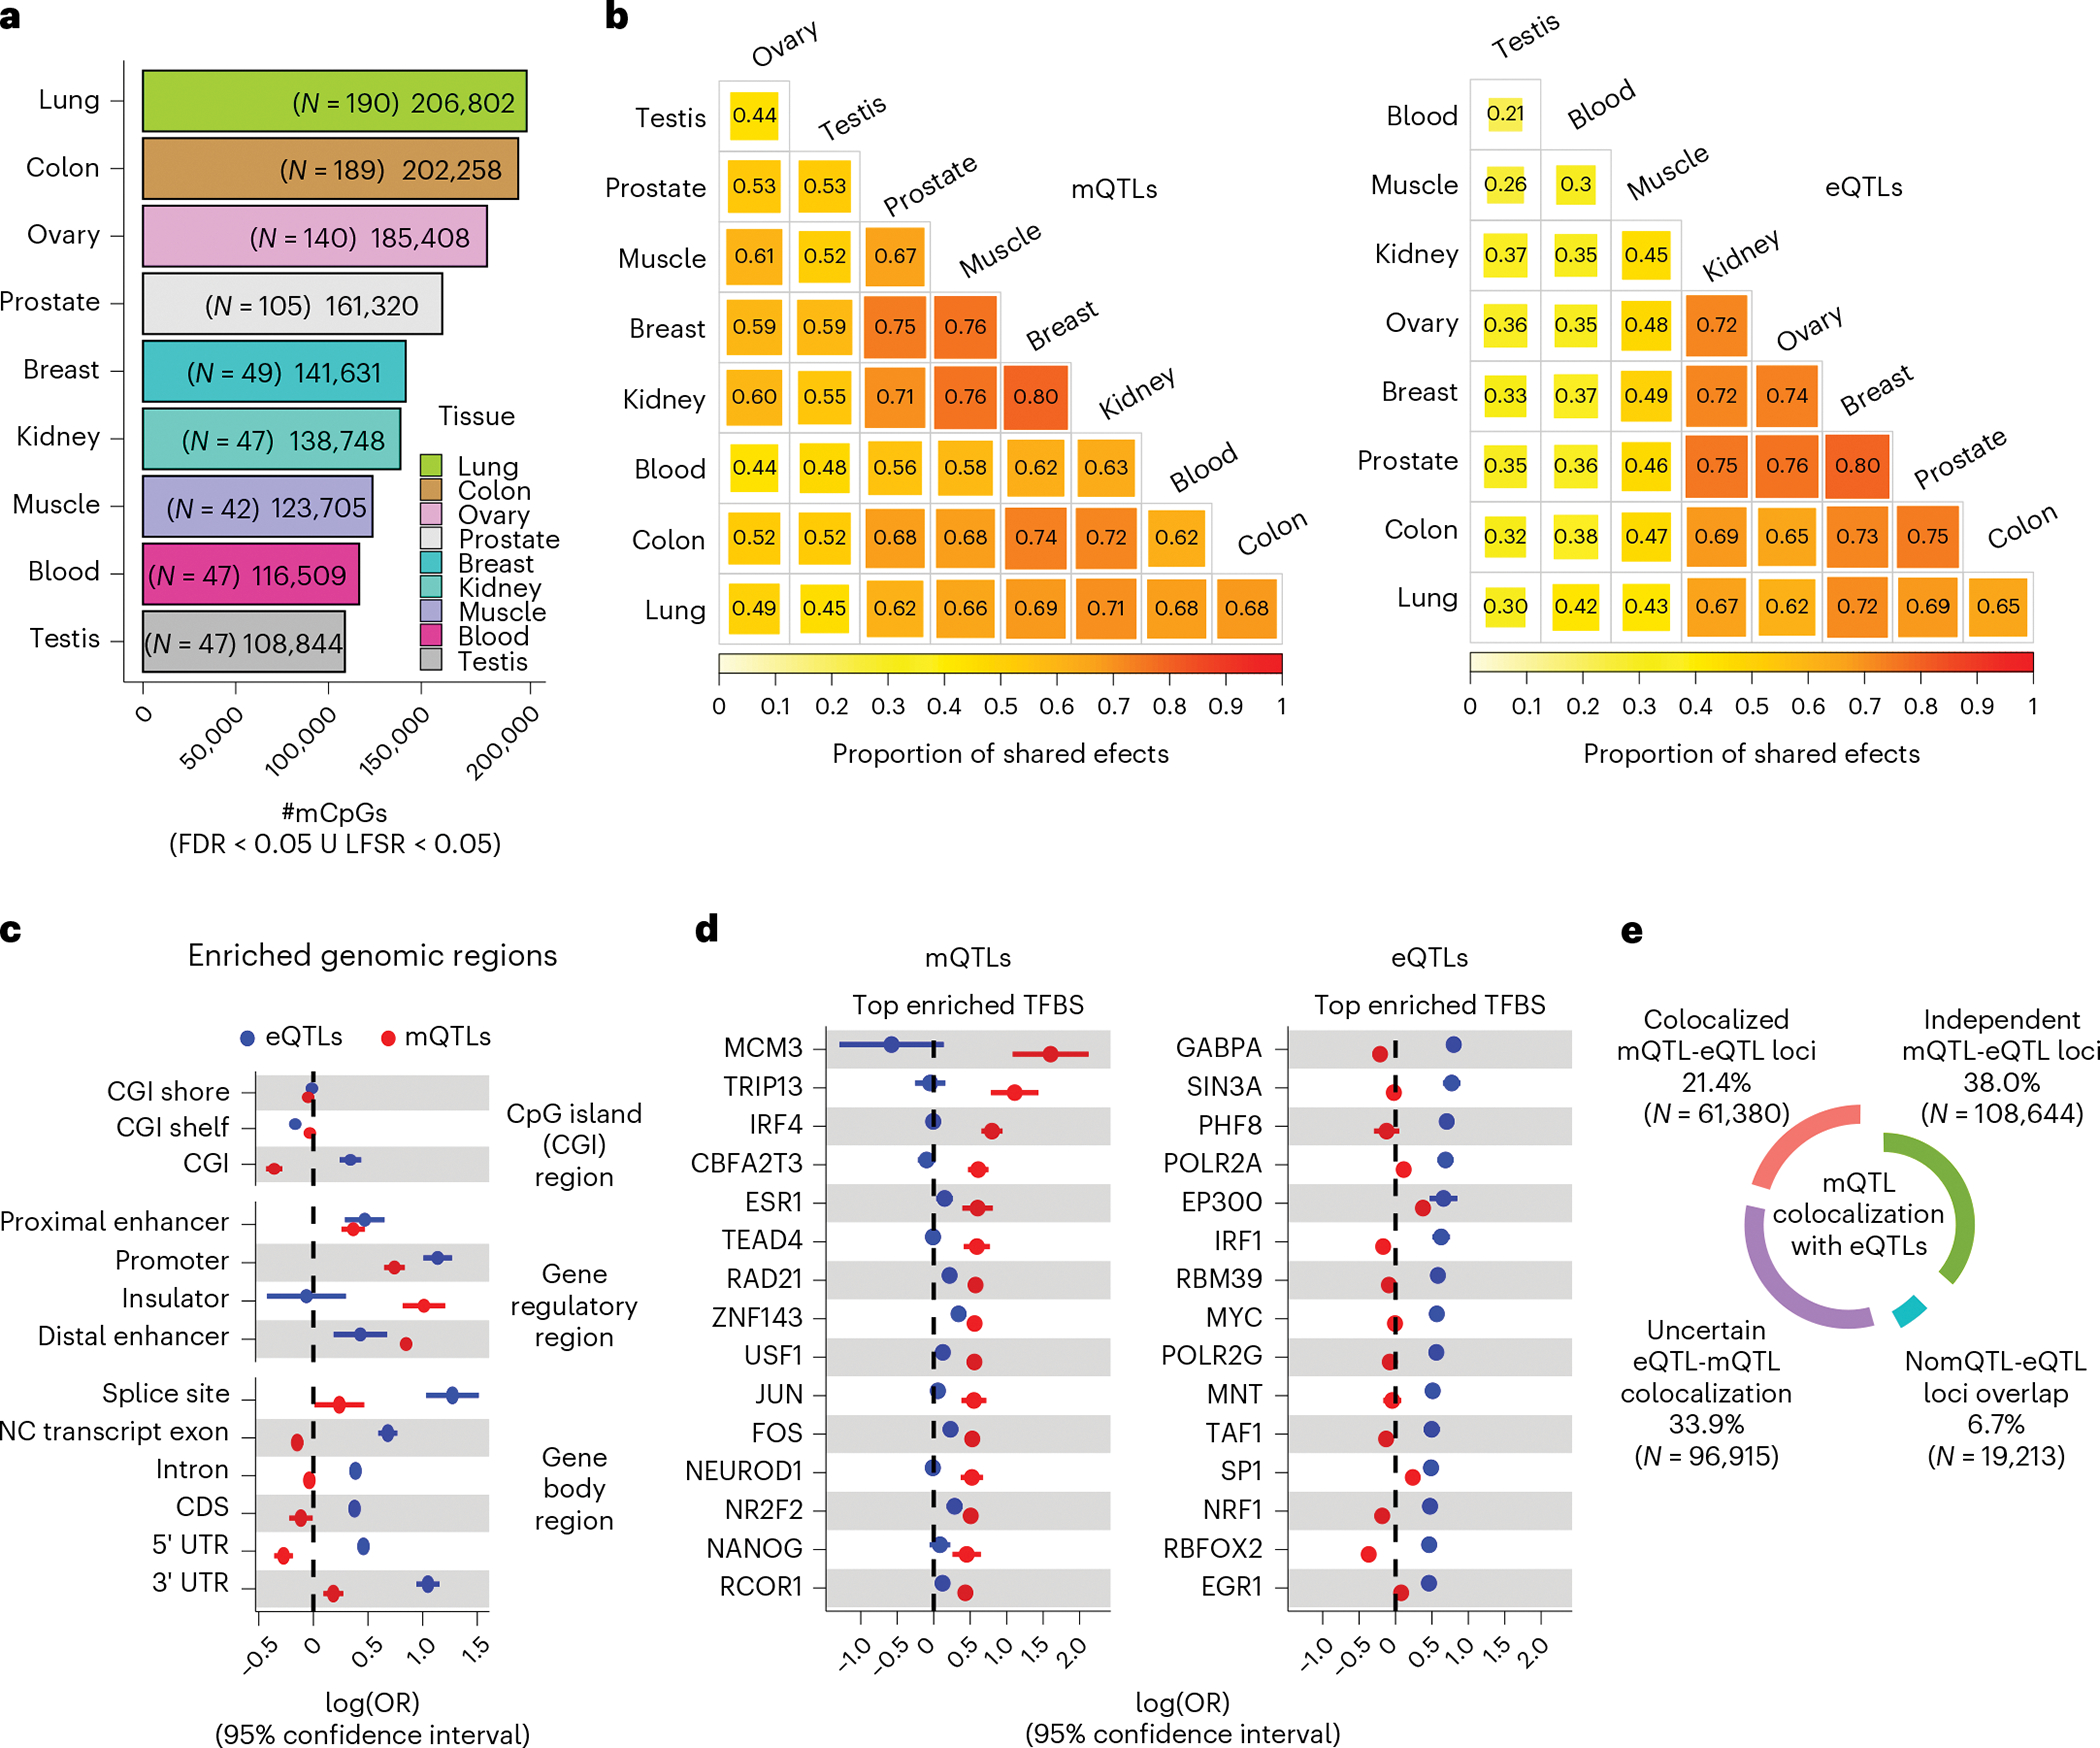
a, Number of CpGs with a mQTL (mCpGs) per tissue defined at local false sign rate (LFSR) < 0.05 or FDR < 0.05, shown with per-tissue mQTL-mapping sample sizes (N) in parentheses. mCpGs, CpG sites with a significant mQTL association. ∪, union. b, Cross-tissue sharing of mQTL (left panel) and eQTL (right panel) tissue-leveraged mashr-derived effect magnitudes. Tissues ordered based on hierarchical clustering with complete agglomeration with Euclidean distance. c, QTL enrichment (x axis) in CpG islands (CGIs), gene body sites and candidate cis-regulatory elements. NC, non-coding; CDS, coding sequence; UTR, untranslated exon region.; OR, odds ratio. d, QTL enrichment (x axis) in transcription factor binding sites (TFBS). Top (largest OR value) 15 significant TFBS enrichments for mQTLs (left panel) and eQTLs (right panel) are shown. For panels c and d, enrichment values correspond to maximum-likelihood estimated log(ORs) derived from across-tissue (nine tissues) meta-analysis (Methods), and whiskers represent the 95% confidence interval of the enrichment value. e, Percentage and number (in parentheses) of mQTL loci (FDR < 0.05) relative to eQTL-colocalization (PP4 > 0.5) category.