
Fig. 5 |. Examples of trait-linked e/mQTLs.
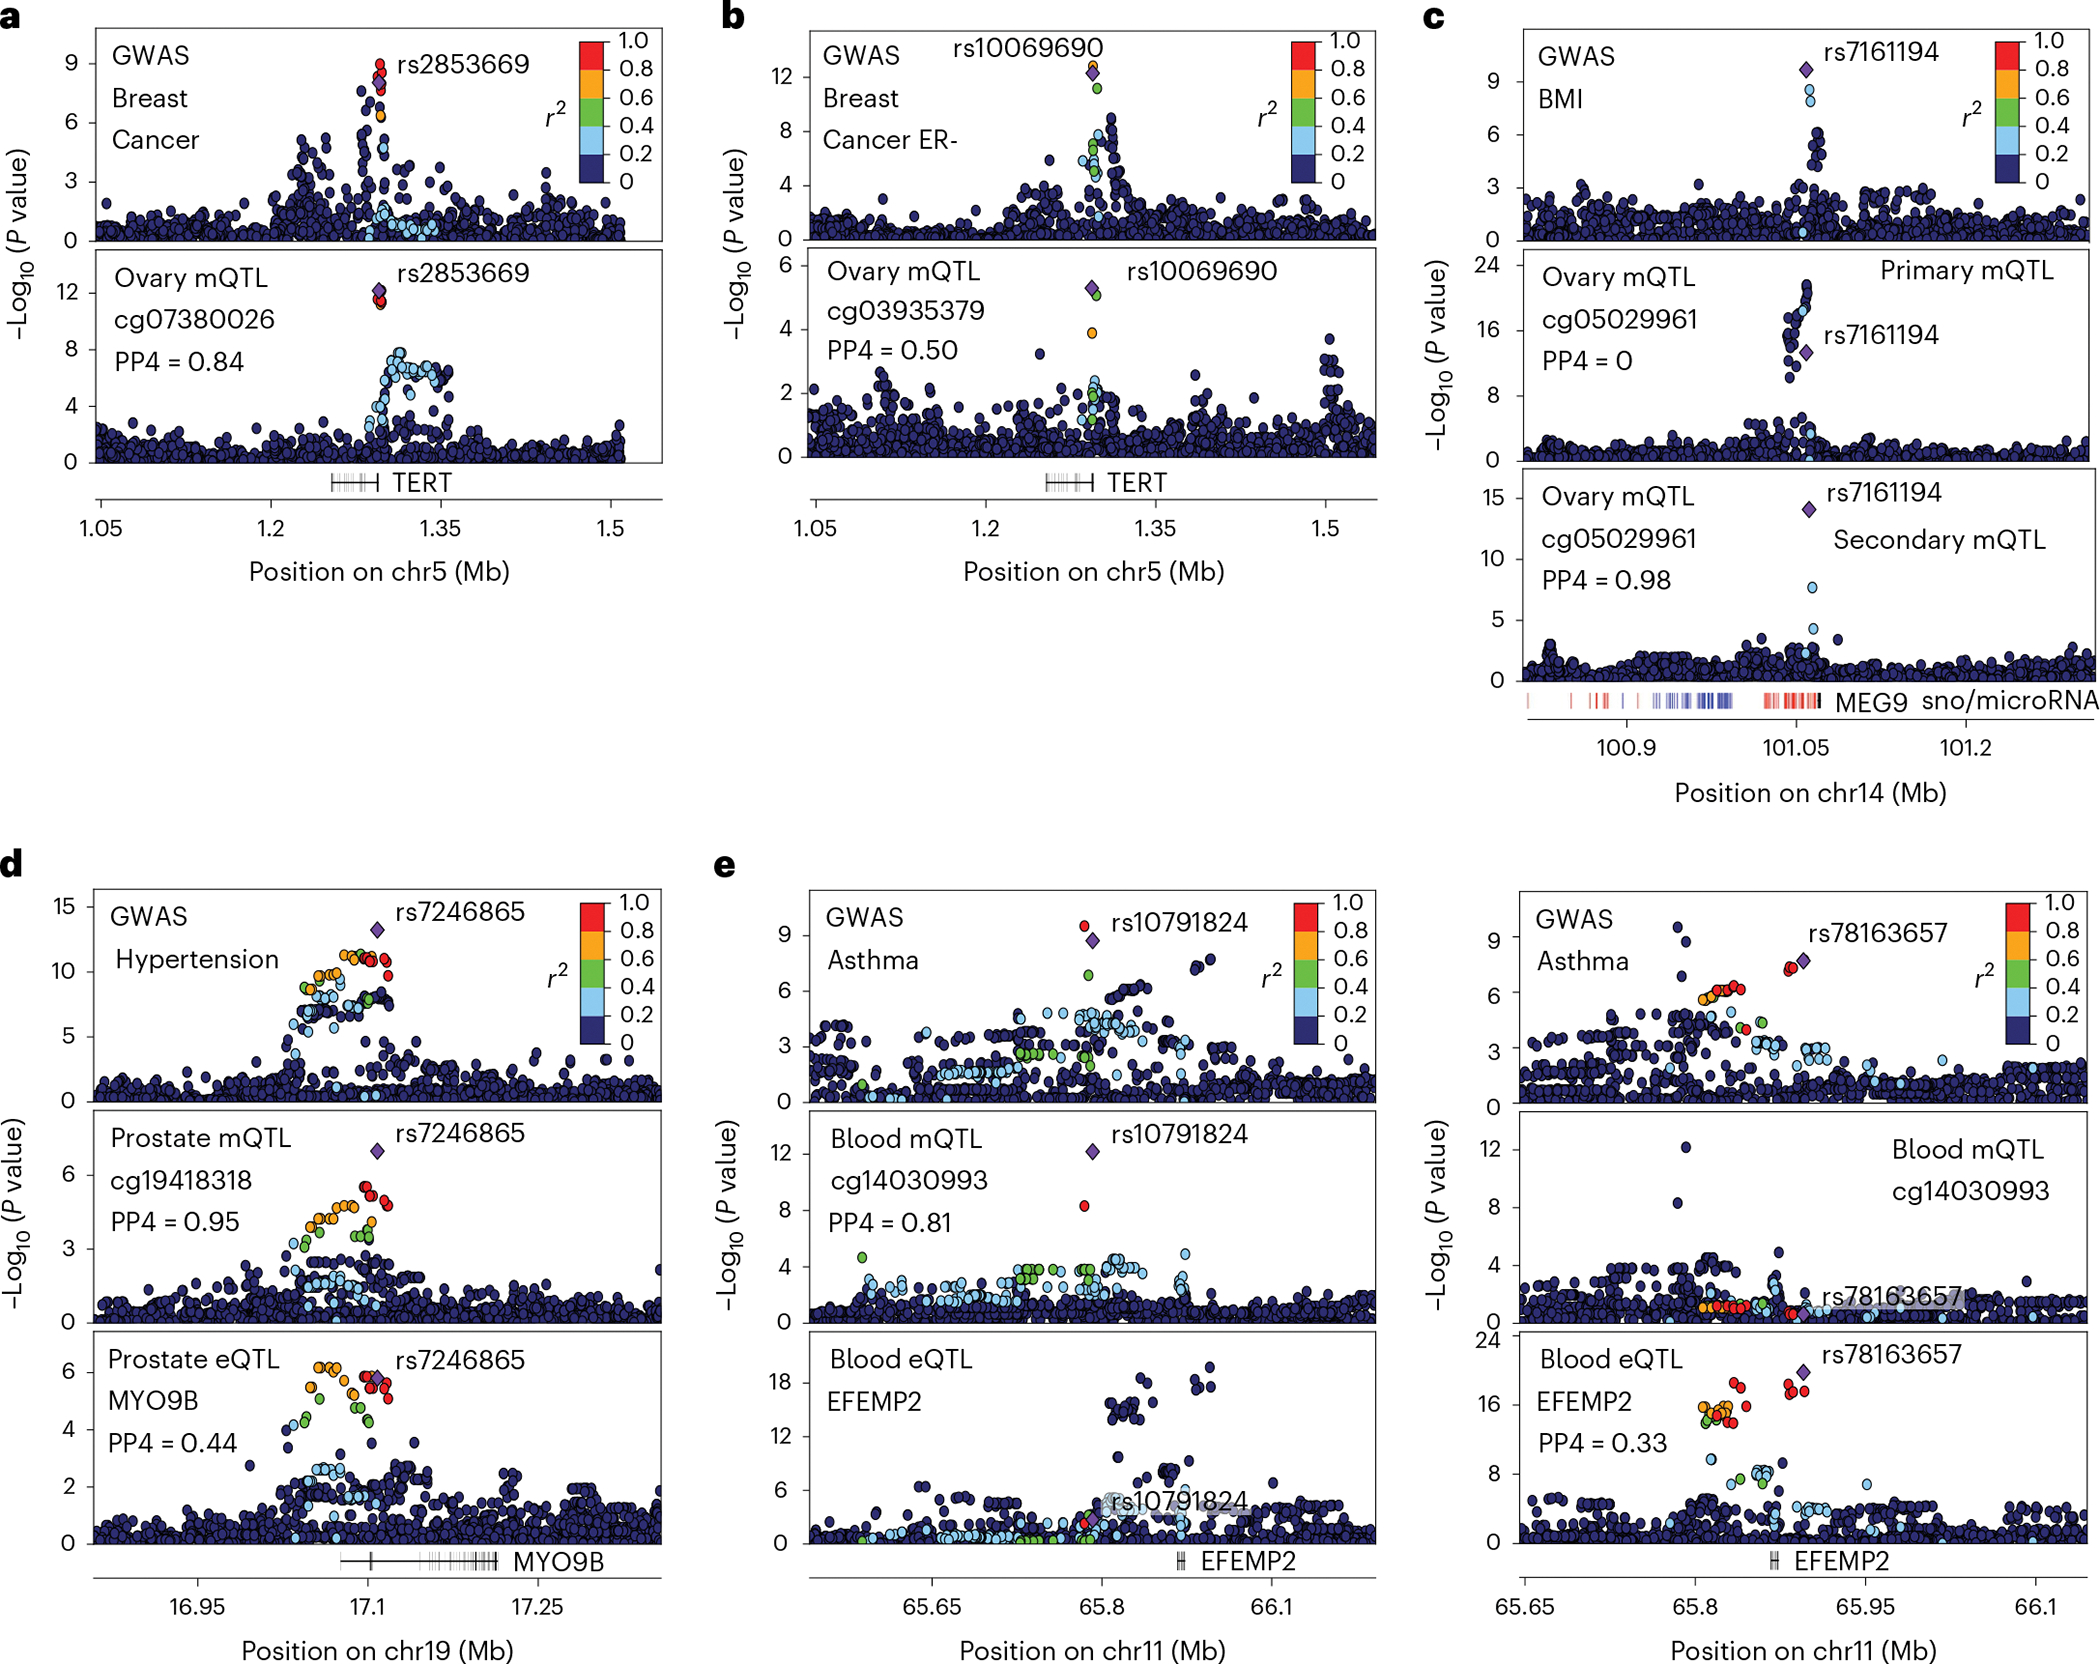
a,b, Genotype-phenotype association P values in the TERT locus for breast cancer GWASs (top panel) and mQTL signal in ovary (bottom panel). c, Genotype-phenotype association P values of the MEG9 locus. Panels illustrate GWAS signal for body mass index (top), cg05029961 primary (middle) and secondary (bottom) mQTL signal in ovary tissue. Secondary mQTL association was obtained adjusting for the top significant variant of primary mQTL signal. Small nucleolar RNA loci (snoRNAs) and microRNA loci are depicted in blue and red, respectively. d, Genotype-phenotype association P values of the MYO9B locus. Panels illustrate GWAS signal for hypertension (top), cg19418318 mQTL signal (middle) and MYO9B eQTL signal (bottom) in prostate. e, Genotype-phenotype association P values of the EFEMP2 locus. Top panels illustrate primary (left) and secondary (right) GWAS signals for asthma. Middle and bottom panels illustrate cg14030993 mQTL and EFEMP2 eQTL signal respectively. For all panels, top GWAS-colocalized e/mQTL is typed in bold, linkage disequilibrium between loci is quantified by squared Pearson coefficient of correlation (r2), and colocalization probability (PP4) of mQTL with GWAS signal is shown. In panels a, c and d, the diamond-shaped point represents the top significant mQTL variant; in panel b, it represents the top significant secondary QTL variant; in panel e, it represents either the top significant mQTL (left) or eQTL (right) variant. P values correspond to nominal GWAS or QTL associations, derived from multiple regression two-sided t-tests.