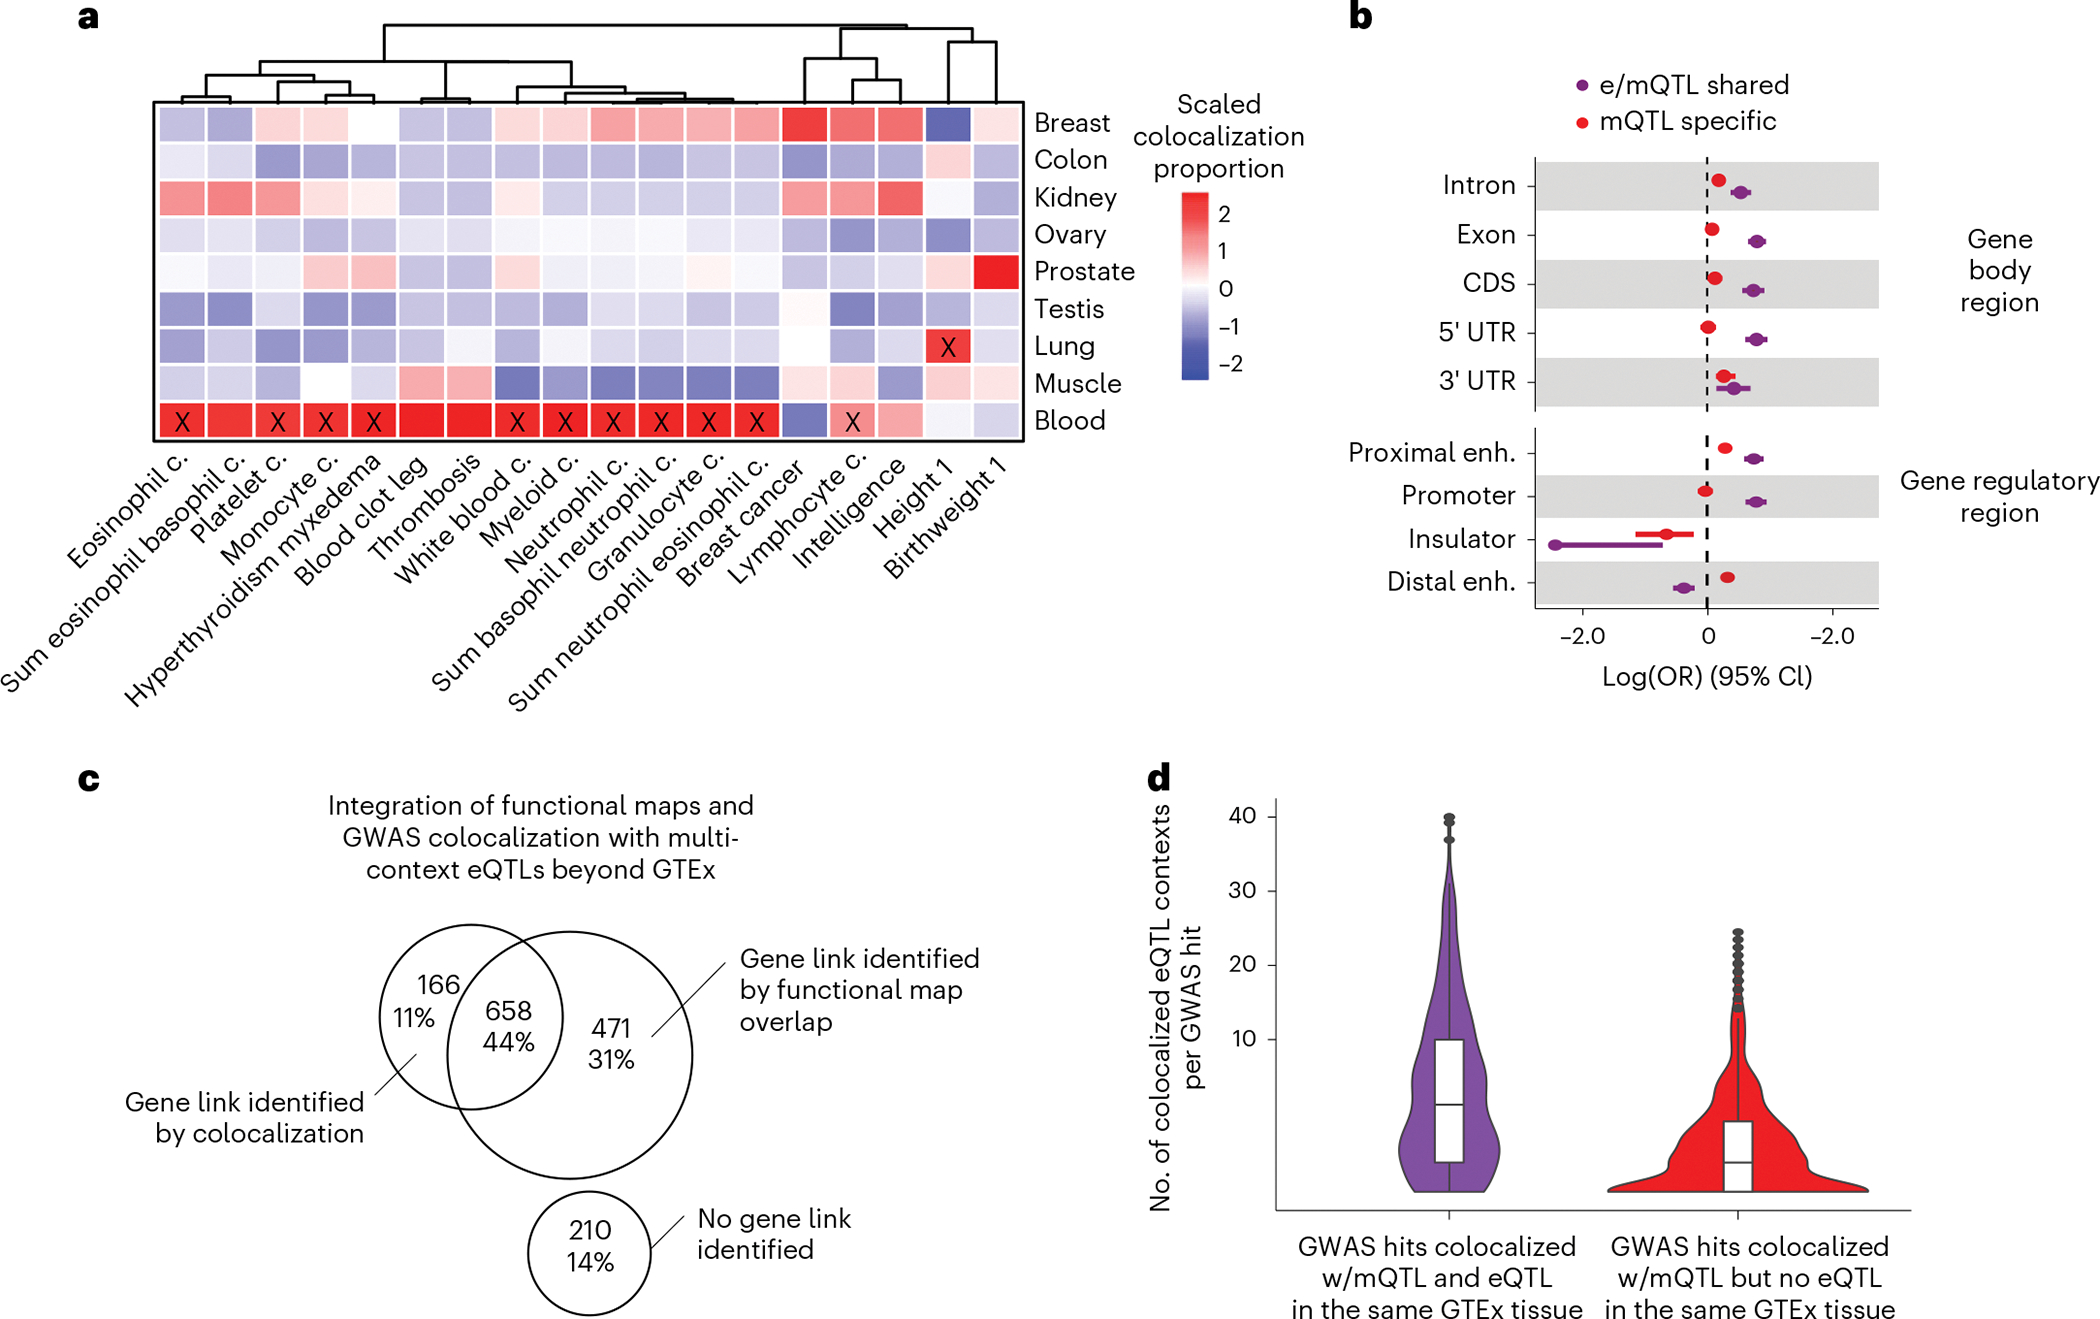
Fig. 6 |. Characteristics of trait-linked mQTLs.

a, Proportion of colocalized mQTLs with GWAS hits per tissue (y axis) and GWAS trait (x axis) scaled by GWAS trait. GWAS traits are clustered by trait-wise scaled colocalization proportion values. Significant (Fisher’s two-sided exact test Bonferroni-corrected P < 0.01) tissue-trait enrichments are labeled with a black cross. b, Trait-linked mCpG enrichment (x axis) in gene body regions and candidate cis-regulatory elements, stratified by QTL-GWAS colocalization group (Fig. 4). Enrichment values correspond to maximum-likelihood estimates of the OR, derived from N = 270,783 trait-association tested mCpGs, and whiskers represent the 95% confidence interval of the enrichment value. enh., enhancer. c, Venn diagram represents overlap between GWAS hits with absence or presence of identified gene links by integrative approach. Analyzed GWAS hits were derived from the previous pairwise colocalization approach, considering mQTL-specific loci, that is mQTL-GWAS colocalizations in absence of eQTL-GWAS colocalization in the same GTEx tissue source (Fig. 4). d, Number of eQTL contexts/catalogs per eQTL-mQTL-GWAS-colocalized cluster (y axis, square-root transformed) derived from the multivariate colocalization approach considering 61 eQTL contexts/catalogs beyond GTEx (Methods). Observations are stratified by QTL-GWAS colocalization group derived from the previous pairwise colocalization approach, that is mQTL-GWAS colocalizations in presence (e/mQTL shared) or absence (mQTL specific) of eQTL-GWAS colocalization in the same GTEx tissue source (Fig. 4).
