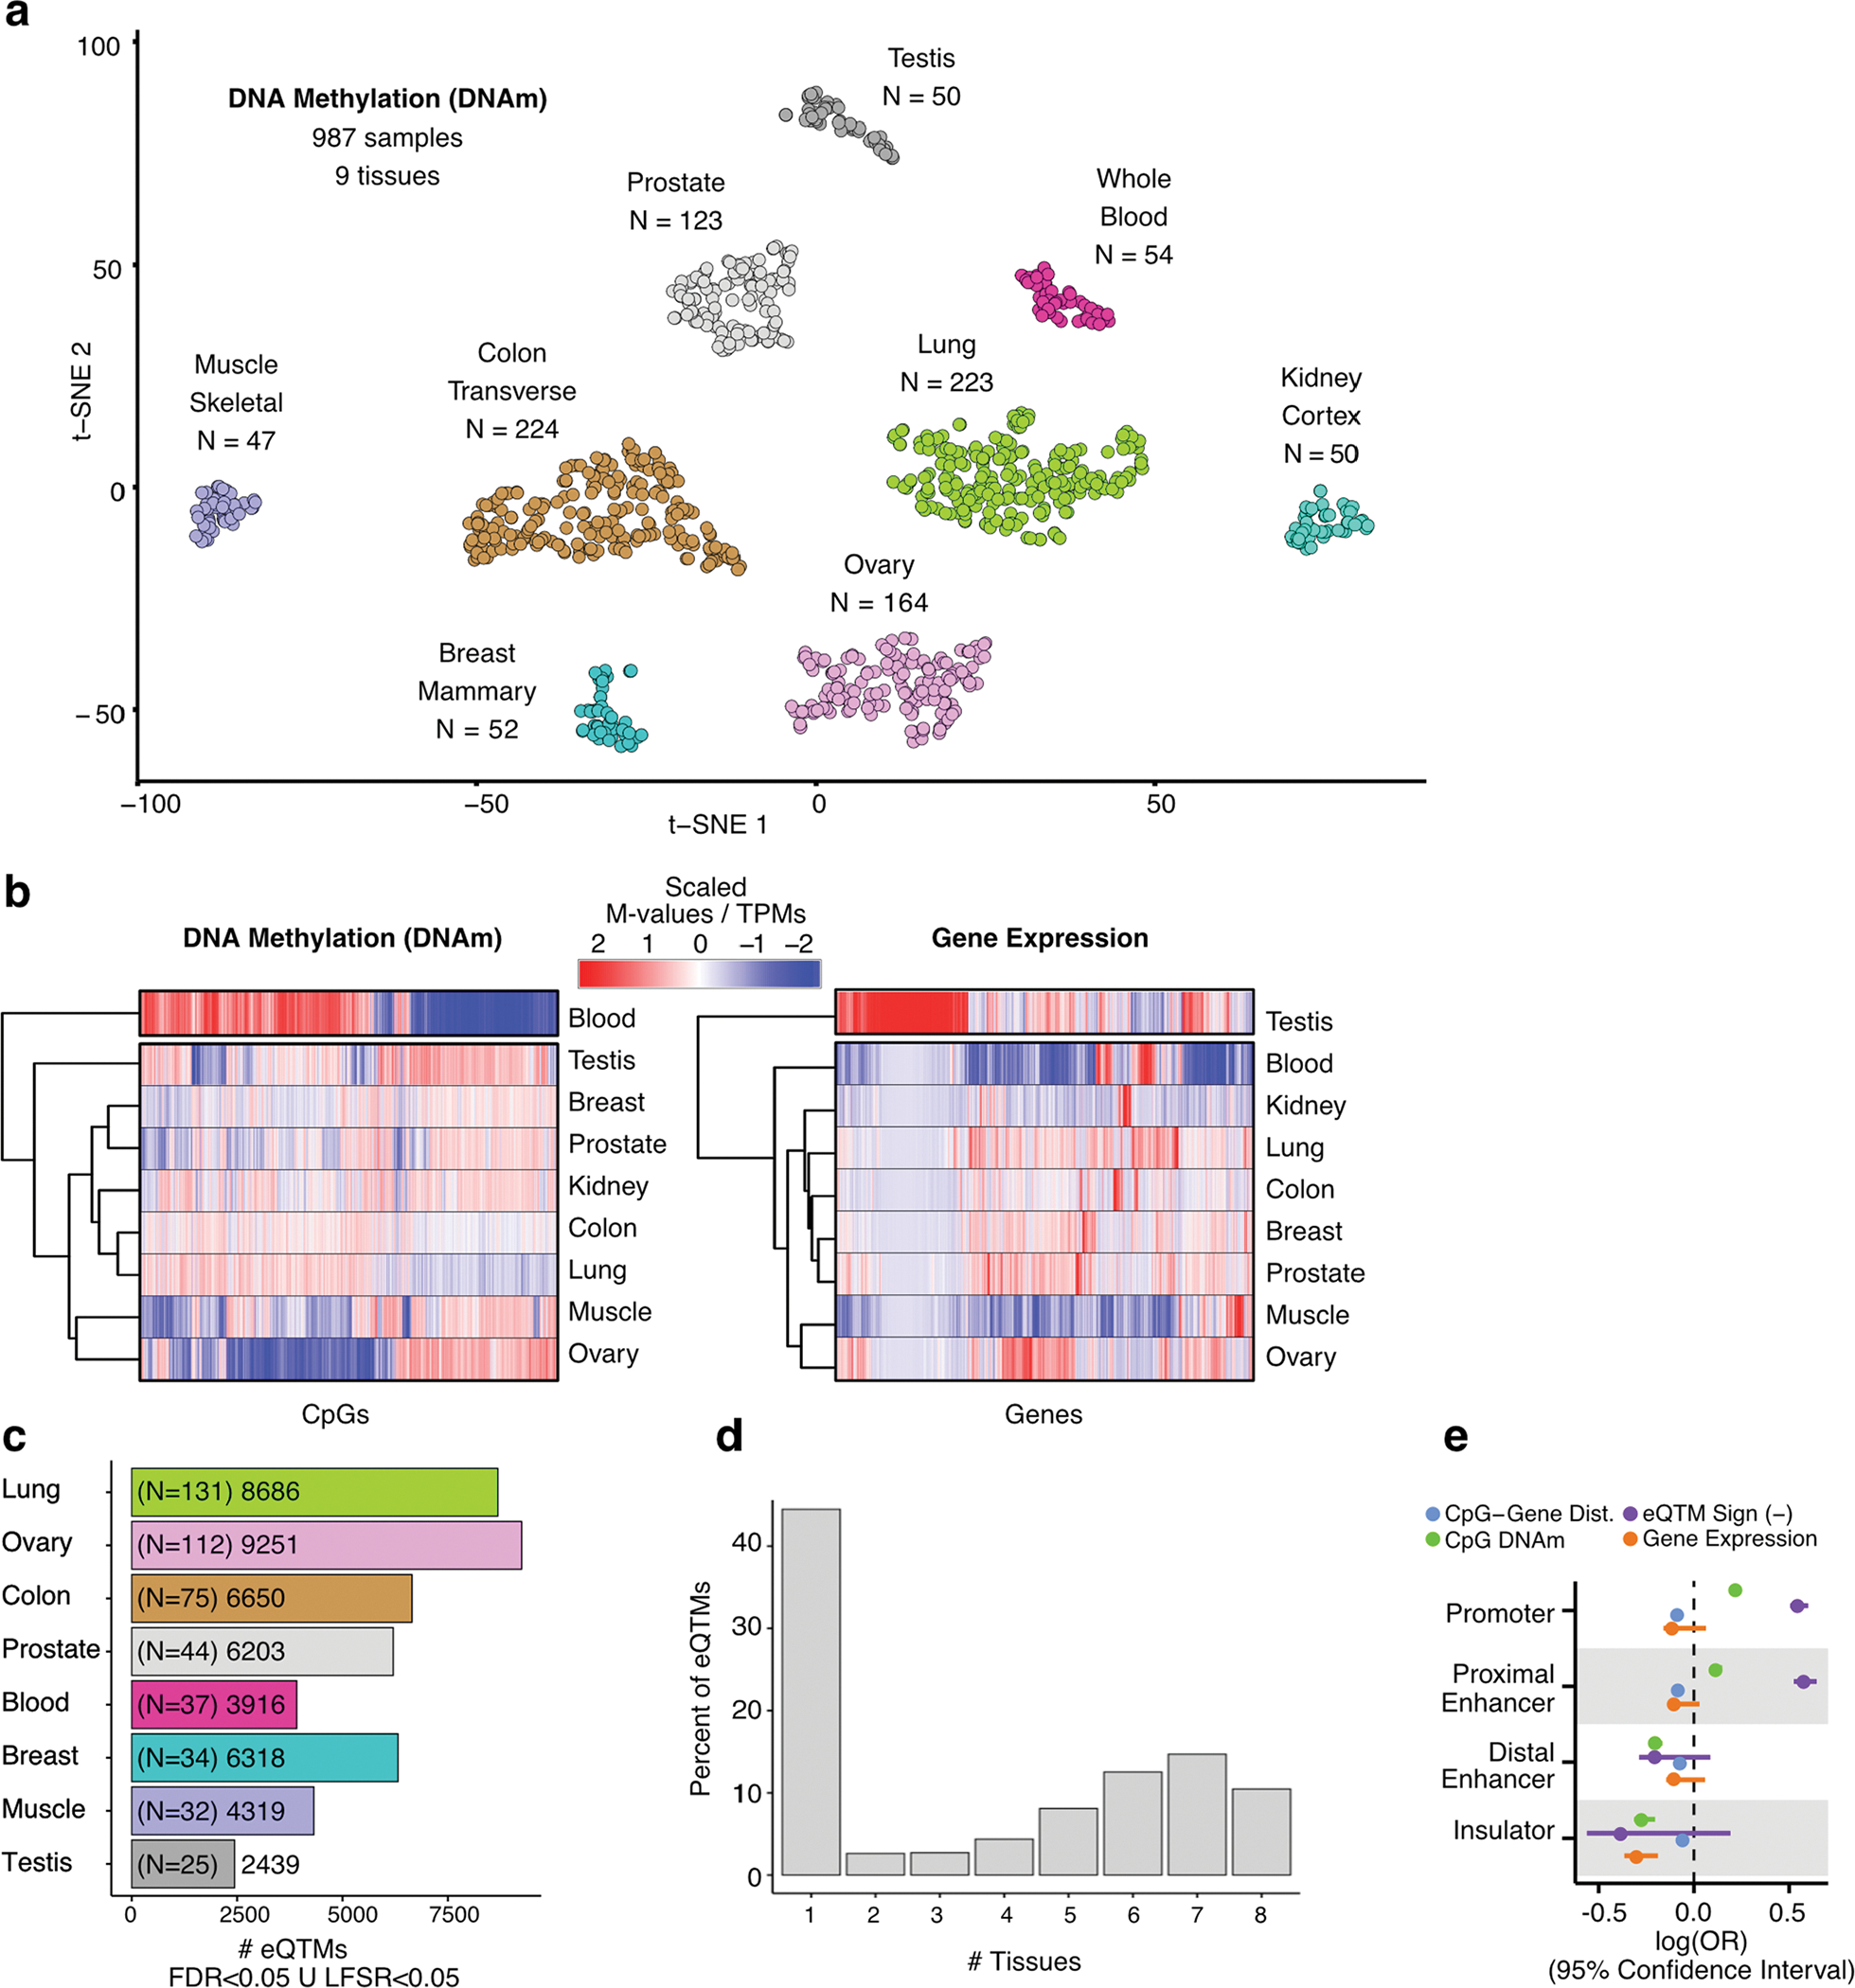
Extended Data Fig. 1 |. Characterization of methylomes across tissues, eQTM discovery and tissue specificity patterns.

(a) Sample similarity based on DNAm profiles. Dimensionality reduction was performed with a t-Distributed Stochastic Neighbor Embedding approach (t-SNE). (b) Hierarchical tissue clustering based on complete methylomes (left panel) and transcriptomes (right panel) of nine tissues (x axis). The molecular phenotypes displayed (y axis) correspond to the top 20,000 most divergent CpG sites and genes across tissues. DNAm and gene expression values are column-wise scaled. (c) Number of eQTMs per tissue, defined at LFSR < 0.05 or FDR < 0.05, shown with per-tissue eQTM-mapping sample sizes in parentheses. FDR: False Discovery Rate. LFSR: Local False Sign Rate. (d) Tissue sharing profile of eQTMs. (e) Contribution (x axis, square-root transformed log(OR)) of selected factors to eQTM likelihood (presence) for different gene regulatory elements (y axis). Dist.: Distance. OR: Odds Ratio. Factor units: CpG–gene distance [Kb], eQTM Sign [‘1’ for negative correlation between methylation and expression, ‘0’ otherwise], CpG DNAm [M-value], gene expression [log2(TPM + 1)]. OR estimates were derived from across-tissue meta-analysis (nine tissues) of predictor coefficients of eQTM likelihood, fitted with a logistic regression model (Methods).
