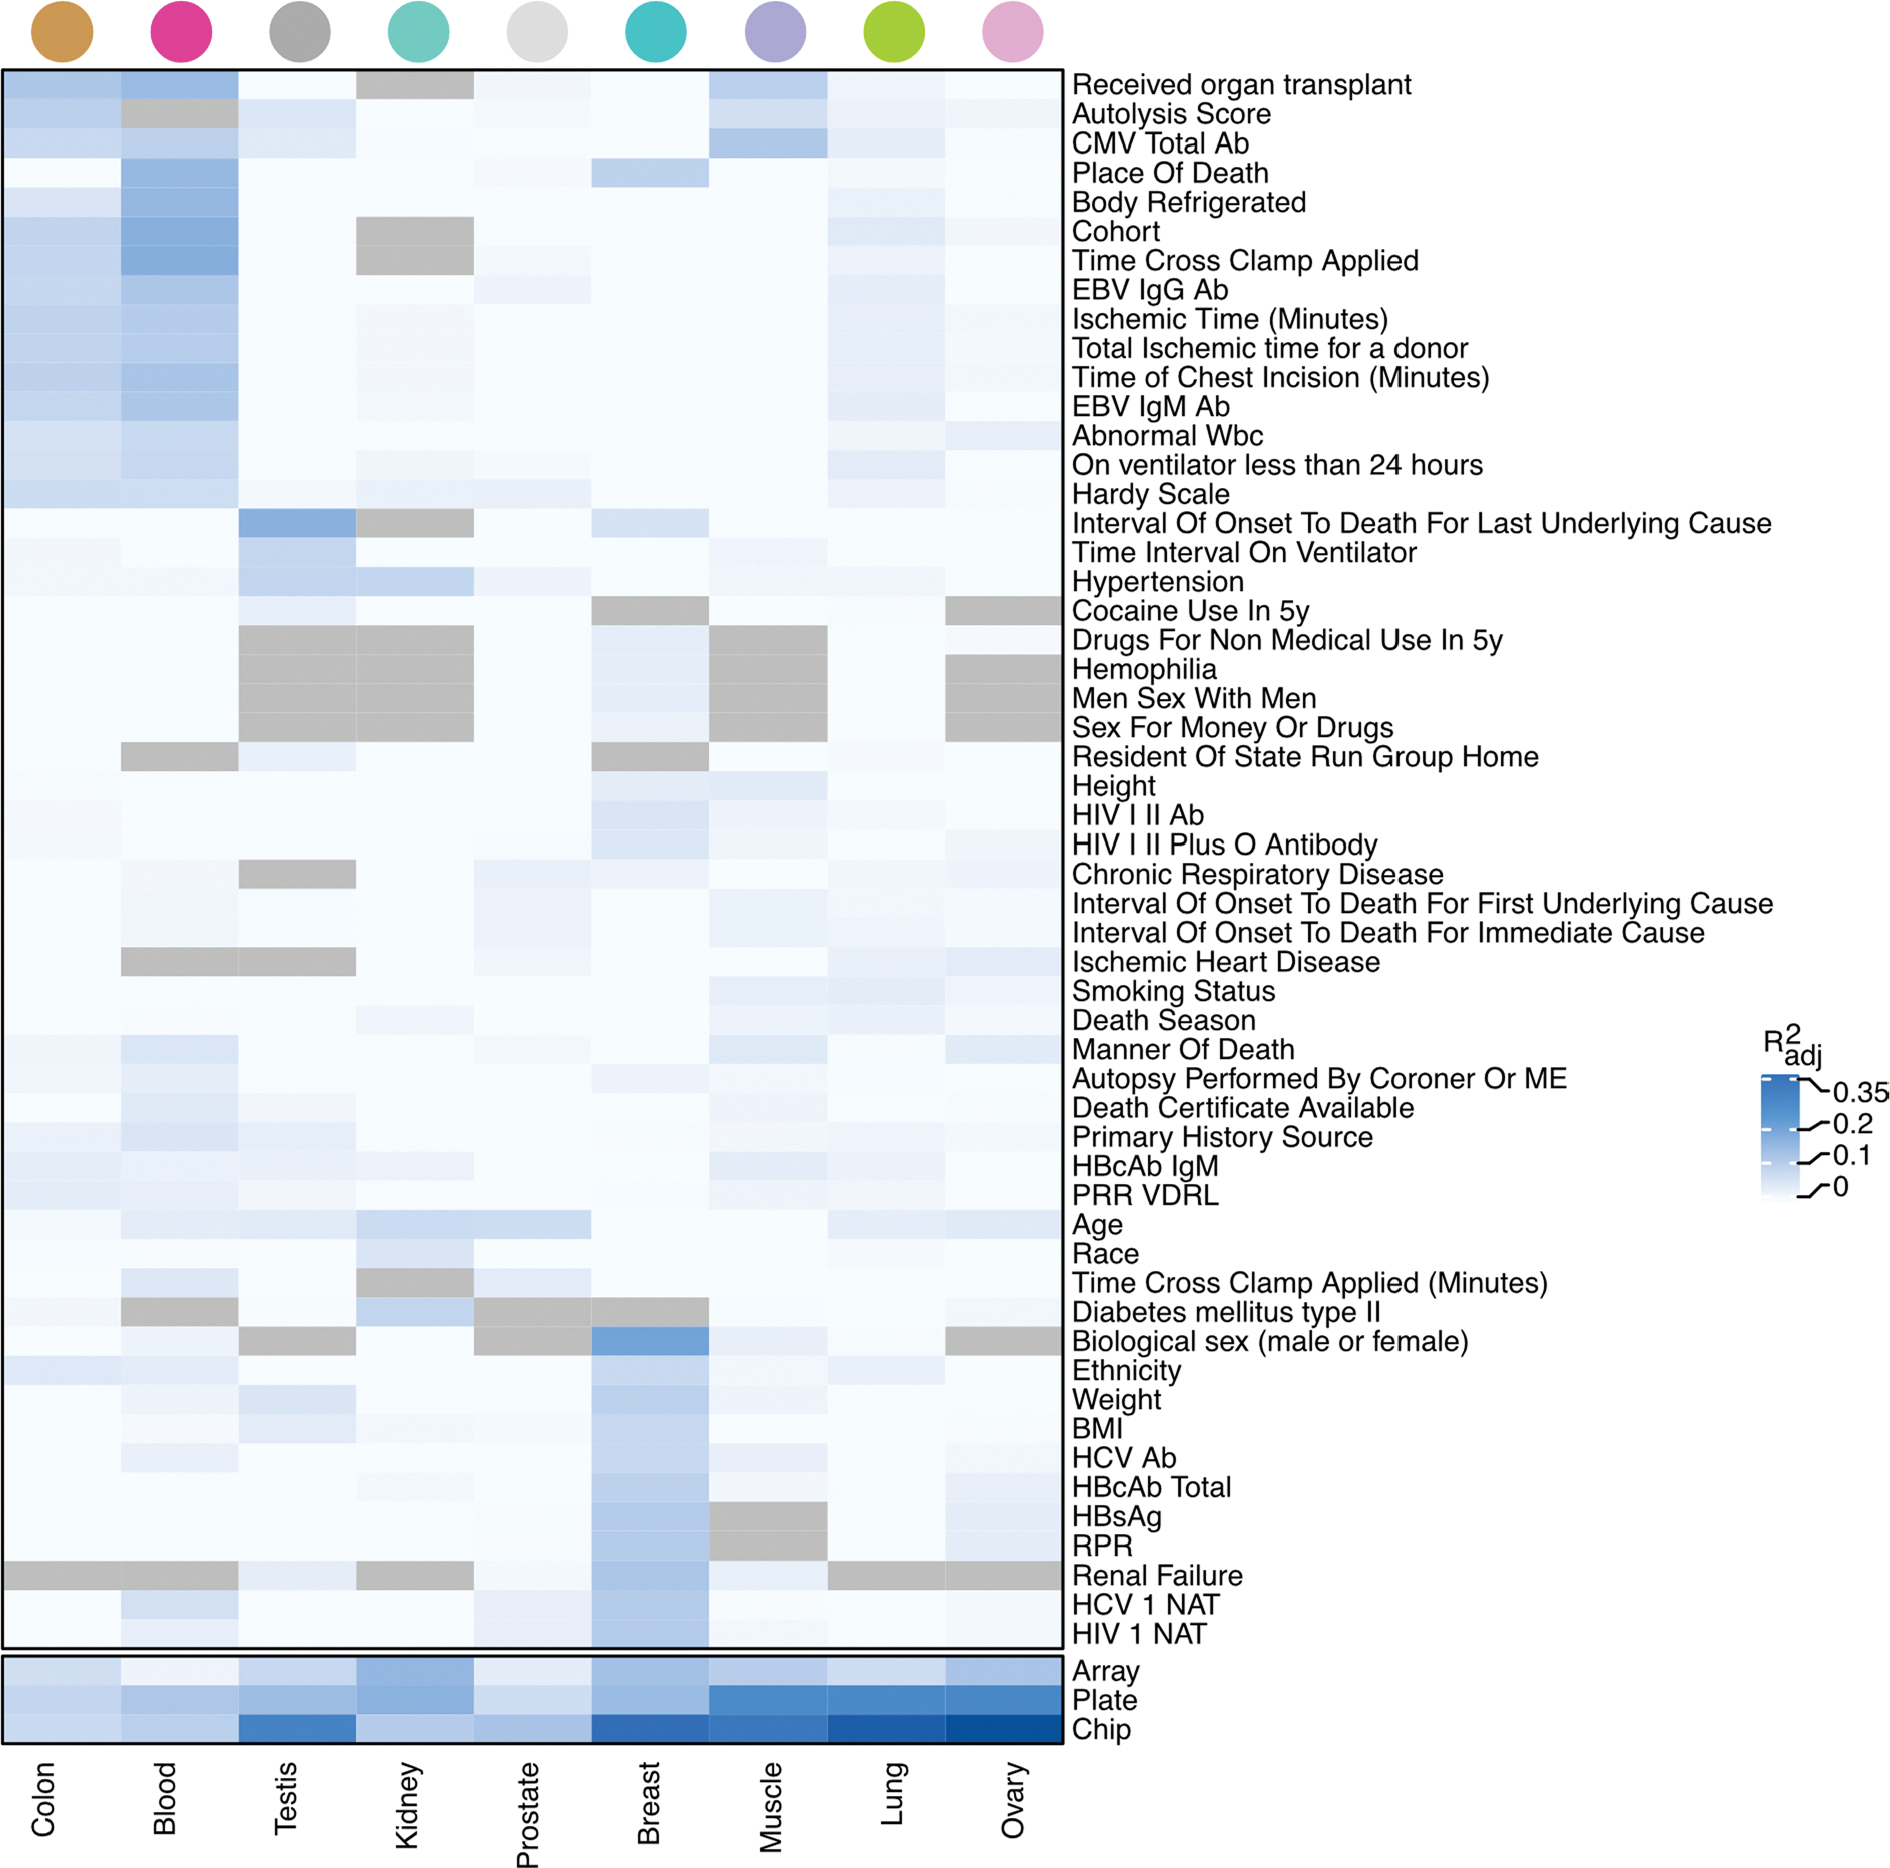
Extended Data Fig. 2 |. DNAm-derived PEER factors association with technical, clinical and epidemiological covariates.

Proportion of variance - mean adjusted R2 across top three PEERs (R2adj) - of the PEER factors explained in part by known donor and sample clinical and biological covariates. Each cell shows the proportion of variance explained by the covariate with respect to the three top PEERs in a specific tissue. Only covariates with R2adj ≥ 0.02 in any tissue are shown. Tissues and covariates are ordered based on hierarchical clustering with complete agglomeration with Euclidean distance. Gray cells indicate unavailable data. The cells at the bottom of the panel shows that the PEERs are capturing batch effects, as expected.
