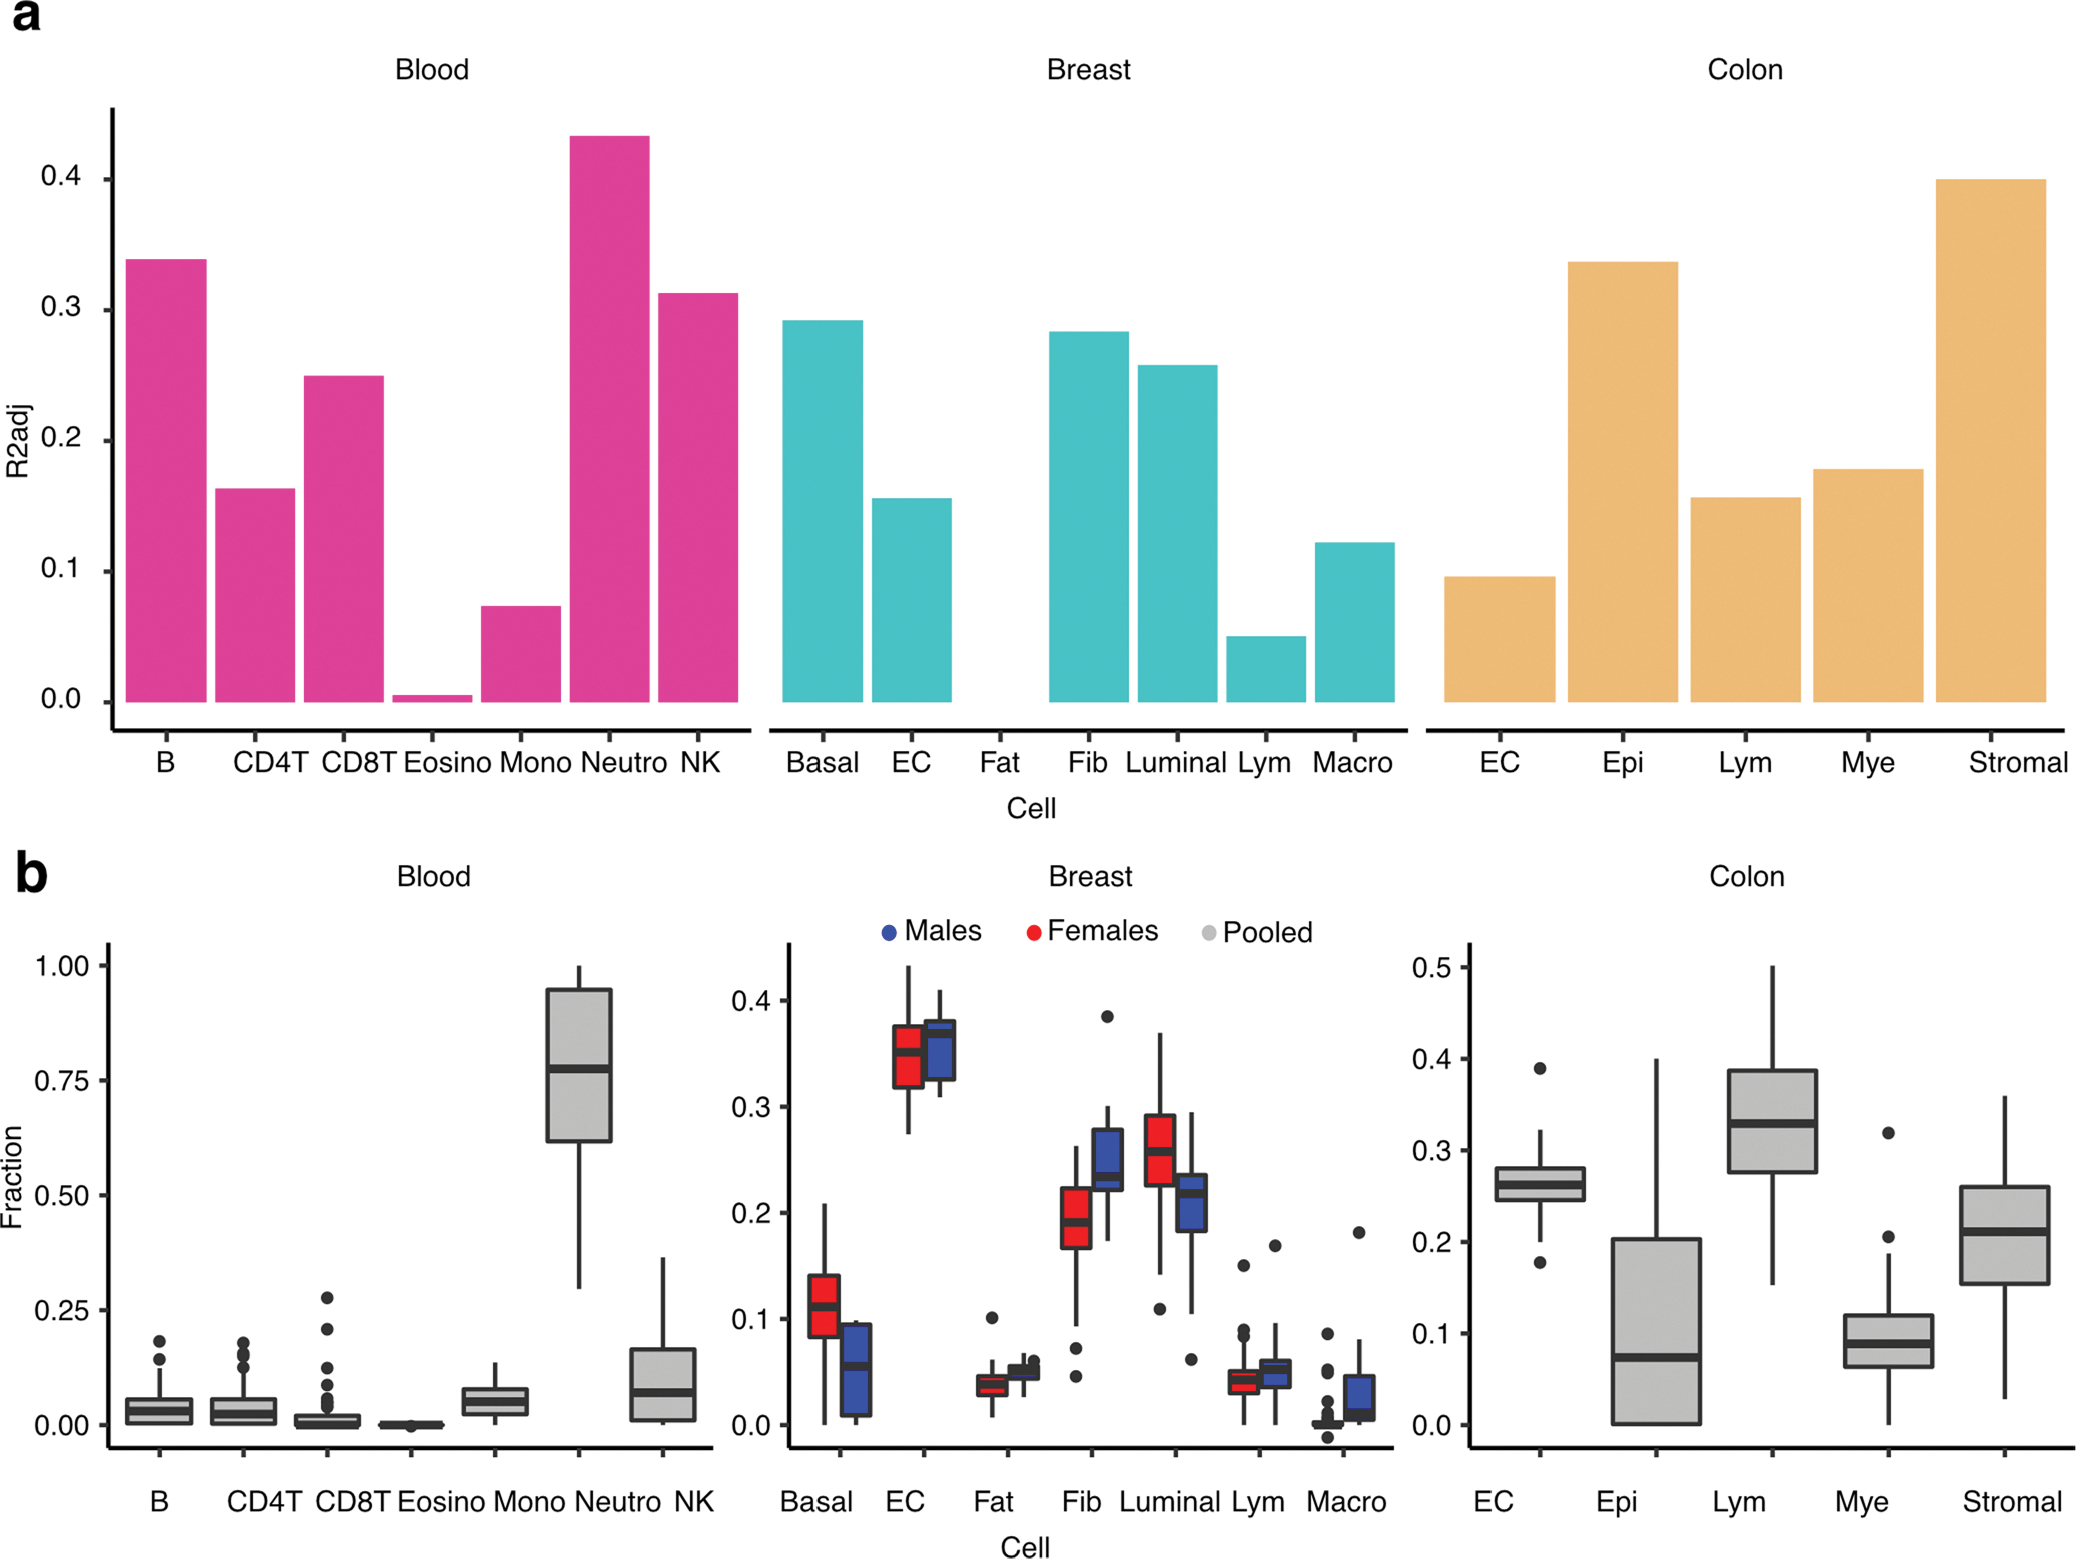
Extended Data Fig. 3 |. DNAm-derived PEER factors association with tissue cellular abundances.

Proportion of variance - mean adjusted R2 across top three PEERs (R2adj) - of the PEER factors explained in part by tissue cellular abundances. Each bar shows the proportion of variance explained by the cell abundance with respect to the three top PEERs in a specific tissue. (b) Fraction of cell abundance (y axis) estimated by DNAm cell-type deconvolution with EpiSCORE, stratified by cell type (x axis) in corresponding tissue. Breast cell abundances are stratified by sex to illustrate sex-differential cell abundances. Cell abundances were estimated for all available samples per tissue: NBreast,Males = 14, NBreast,Females = 38, NBlood,Pooled = 54, NColon,Pooled = 224. B: B cells, NK: Natural Killer cells, CD4T: CD4+ T-cells, CD8T: CD8+ T-cells, Mono: Monocytes, Neutro: Neutrophils, Eosino: Eosinophils, Basal: Basal Epithelial cells, EC: Endothelial cells, Fat: Adipocytes, Luminal: Luminal Epithelial cells, Lym: Lymphocytes, Macro: Macrophages, Epi: Epithelial cells, Mye: Myeloid cells, Stromal: Stromal cells.
