
Extended Data Fig. 9. Pcdhgc3 overexpression leads to a lateral dispersion of sister and cousin excitatory neurons.
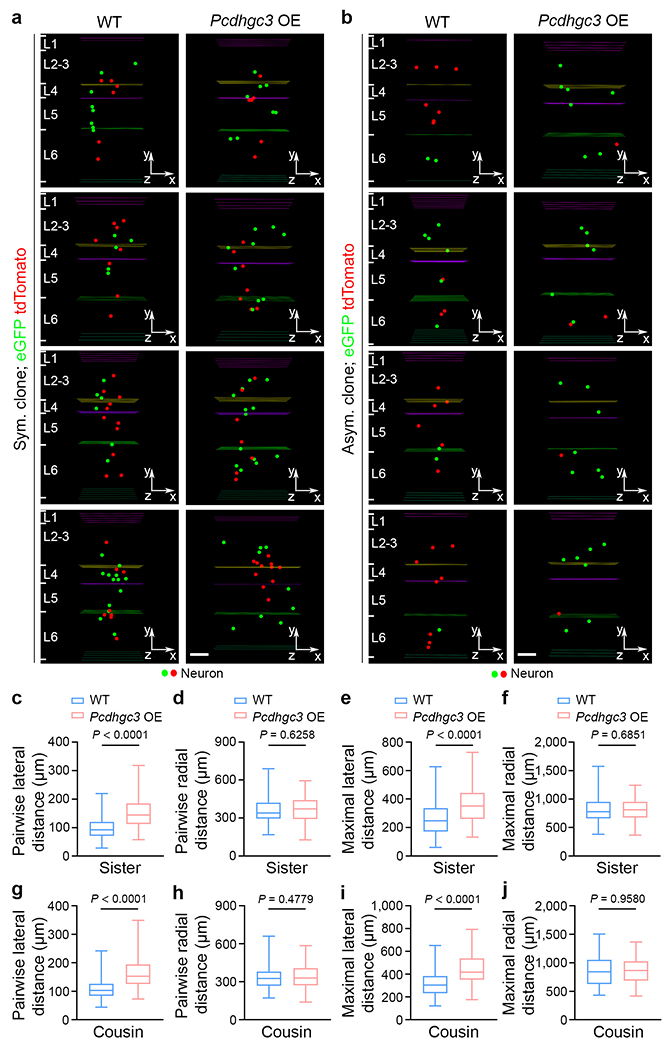
a, b, Representative 3D reconstruction images of P21 WT (left) and Pcdhgc3 OE (right) symmetric (a) and asymmetric (b) excitatory neuron clones labelled by MADM. Coloured lines indicate the layer boundaries and coloured dots represent the cell bodies of labelled neurons. The x-/y-/z-axes indicate the spatial orientation of the clone with the x-axis parallel to the brain pial surface and the y-axis perpendicular to the pial surface. Scale bars: 100 μm. c-f, Quantification of the pairwise (c, d) and maximal (e, f) lateral and radial distances between sister neurons in individual WT and Pcdhgc3 overexpressing clones (WT, n = 99 clones; Pcdhgc3 OE, n = 68 clones). g-j, Quantification of the pairwise (g, h) and maximal (i, j) lateral and radial distances between cousin neurons in individual WT and Pcdhgc3 OE clones (WT, n = 79 clones; Pcdhgc3 OE, n = 86 clones). Data are representative of four independent experiments. Two-tailed unpaired Student’s t-test was used for statistical test. Box plots as in Fig. 1.